

- Bitcoin’s momentum has stalled after it broke above its previous resistance at $9,300
- The cryptocurrency is now flashing some signs of weakness as it struggles to push any higher
- One analyst is pointing to a technical pattern that BTC is currently forming that is strikingly similar to that seen right before its massive plunge in March
- If this pattern does replicate itself, it could lead the crypto significantly lower in the days and weeks ahead
- It is important to note, however, that large whales on Bitfinex have been offloading their short positions, signaling that they anticipate the crypto to climb higher
Bitcoin and the aggregated crypto market have seen some positive price action over the past couple of days.
Although the gains incurred by BTC have been tempered, many altcoins have been able to outperform it significantly. Some top altcoins are even up over 300% since the start of the year.
BTC remains caught within its multi-month trading range that was first formed in early-May.
This range exists between $9,000 and $10,000, and market participants have been unable to surmount either level.
The crypto is currently flashing a massively bearish technical pattern, however, that could signal a sharp downwards movement is imminent.
Bitcoin Continues Consolidating as Whales Offload Their Short Positions
At the time of writing, Bitcoin is trading down marginally at its current price of just beneath $9,400.
The crypto has been trading around this price level for the past day.
Although the break above its $9,300 resistance was notable, it won’t mean much until BTC can climb past the resistance sitting around $9,500 and that within the upper-$9,000 region.
It does appear that some so-called “whales” are expecting the crypto to surmount these levels in the near-term, as data shows that they have been closing their short positions at a rapid pace.
One analyst spoke about this trend in a recent post, saying:
“The USDT whales on Bitfinex gave up. They went heavily short during the final stages of the rally in May, but recently they’ve been offloading pretty much their entire position.”
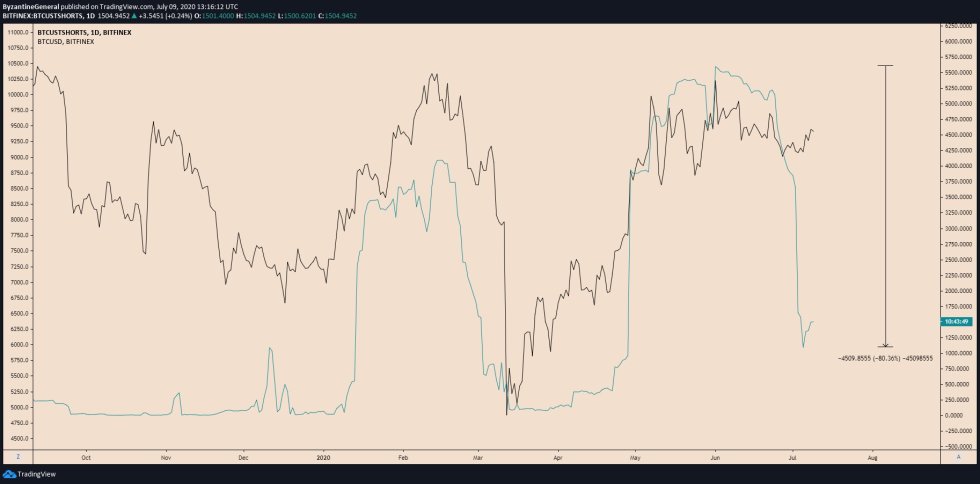

Image Courtesy of Byzantine General. Chart via TradingView.
This Technical Pattern May Spell Trouble for BTC
There is a technical pattern that has been forming throughout the past week that may spell trouble for where Bitcoin goes next.
One analyst pointed to a rising wedge coupled with low volume that is strikingly similar to that seen just before the March meltdown.
He asked, “this time is different?” while offering the chart seen below.
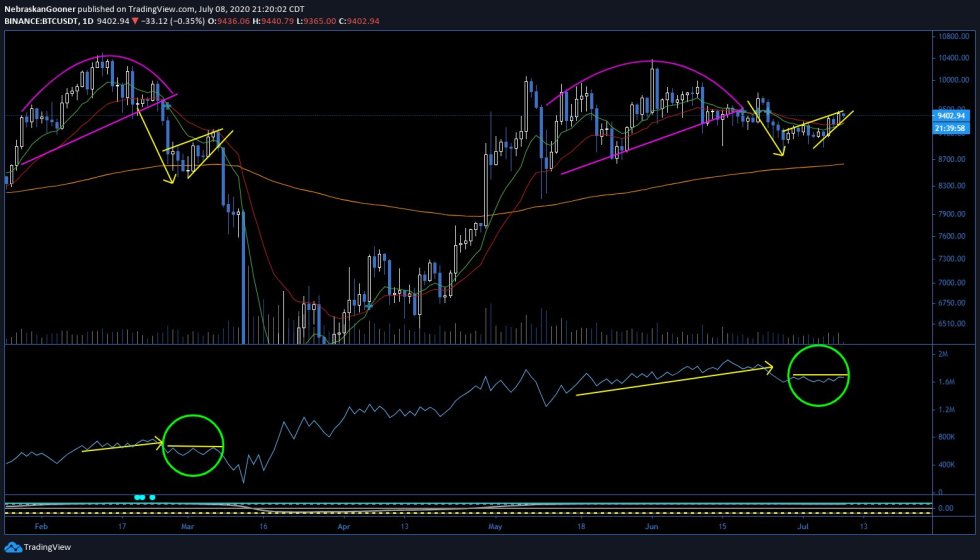

Image Courtesy of NebraskanGooner. Chart via TradingView.
The next couple of days should reveal the validity of this pattern, as any push higher would invalidate it.
Featured image from Shutterstock.
Chart via TradingView.