
On-chain data shows XRP retail investors are up 60% even after the market downturn. Here’s how the figure compares for Bitcoin and Ethereum.
XRP Retail Realized Price Puts Profit Margin Around 60%
In a new post on X, on-chain analytics firm Glassnode has discussed how retail profitability compares between the top assets in the sector: Bitcoin, Ethereum, and XRP. Retail investors refer to the smallest of entities in the market, who don’t hold a significant balance on an individual level (typically less than $1,000). To calculate the profit-loss balance of this cohort, Glassnode has made use of the Realized Price indicator.
The Realized Price measures the average cost basis or acquisition level of a given segment of the network. When the asset’s spot price trades above this level, it means the group is in a state of net unrealized gain. On the other hand, it being under the metric implies the dominance of loss among the cohort members.
First, here is a chart that shows the trend in the Realized Price for the retail investors on the XRP network:

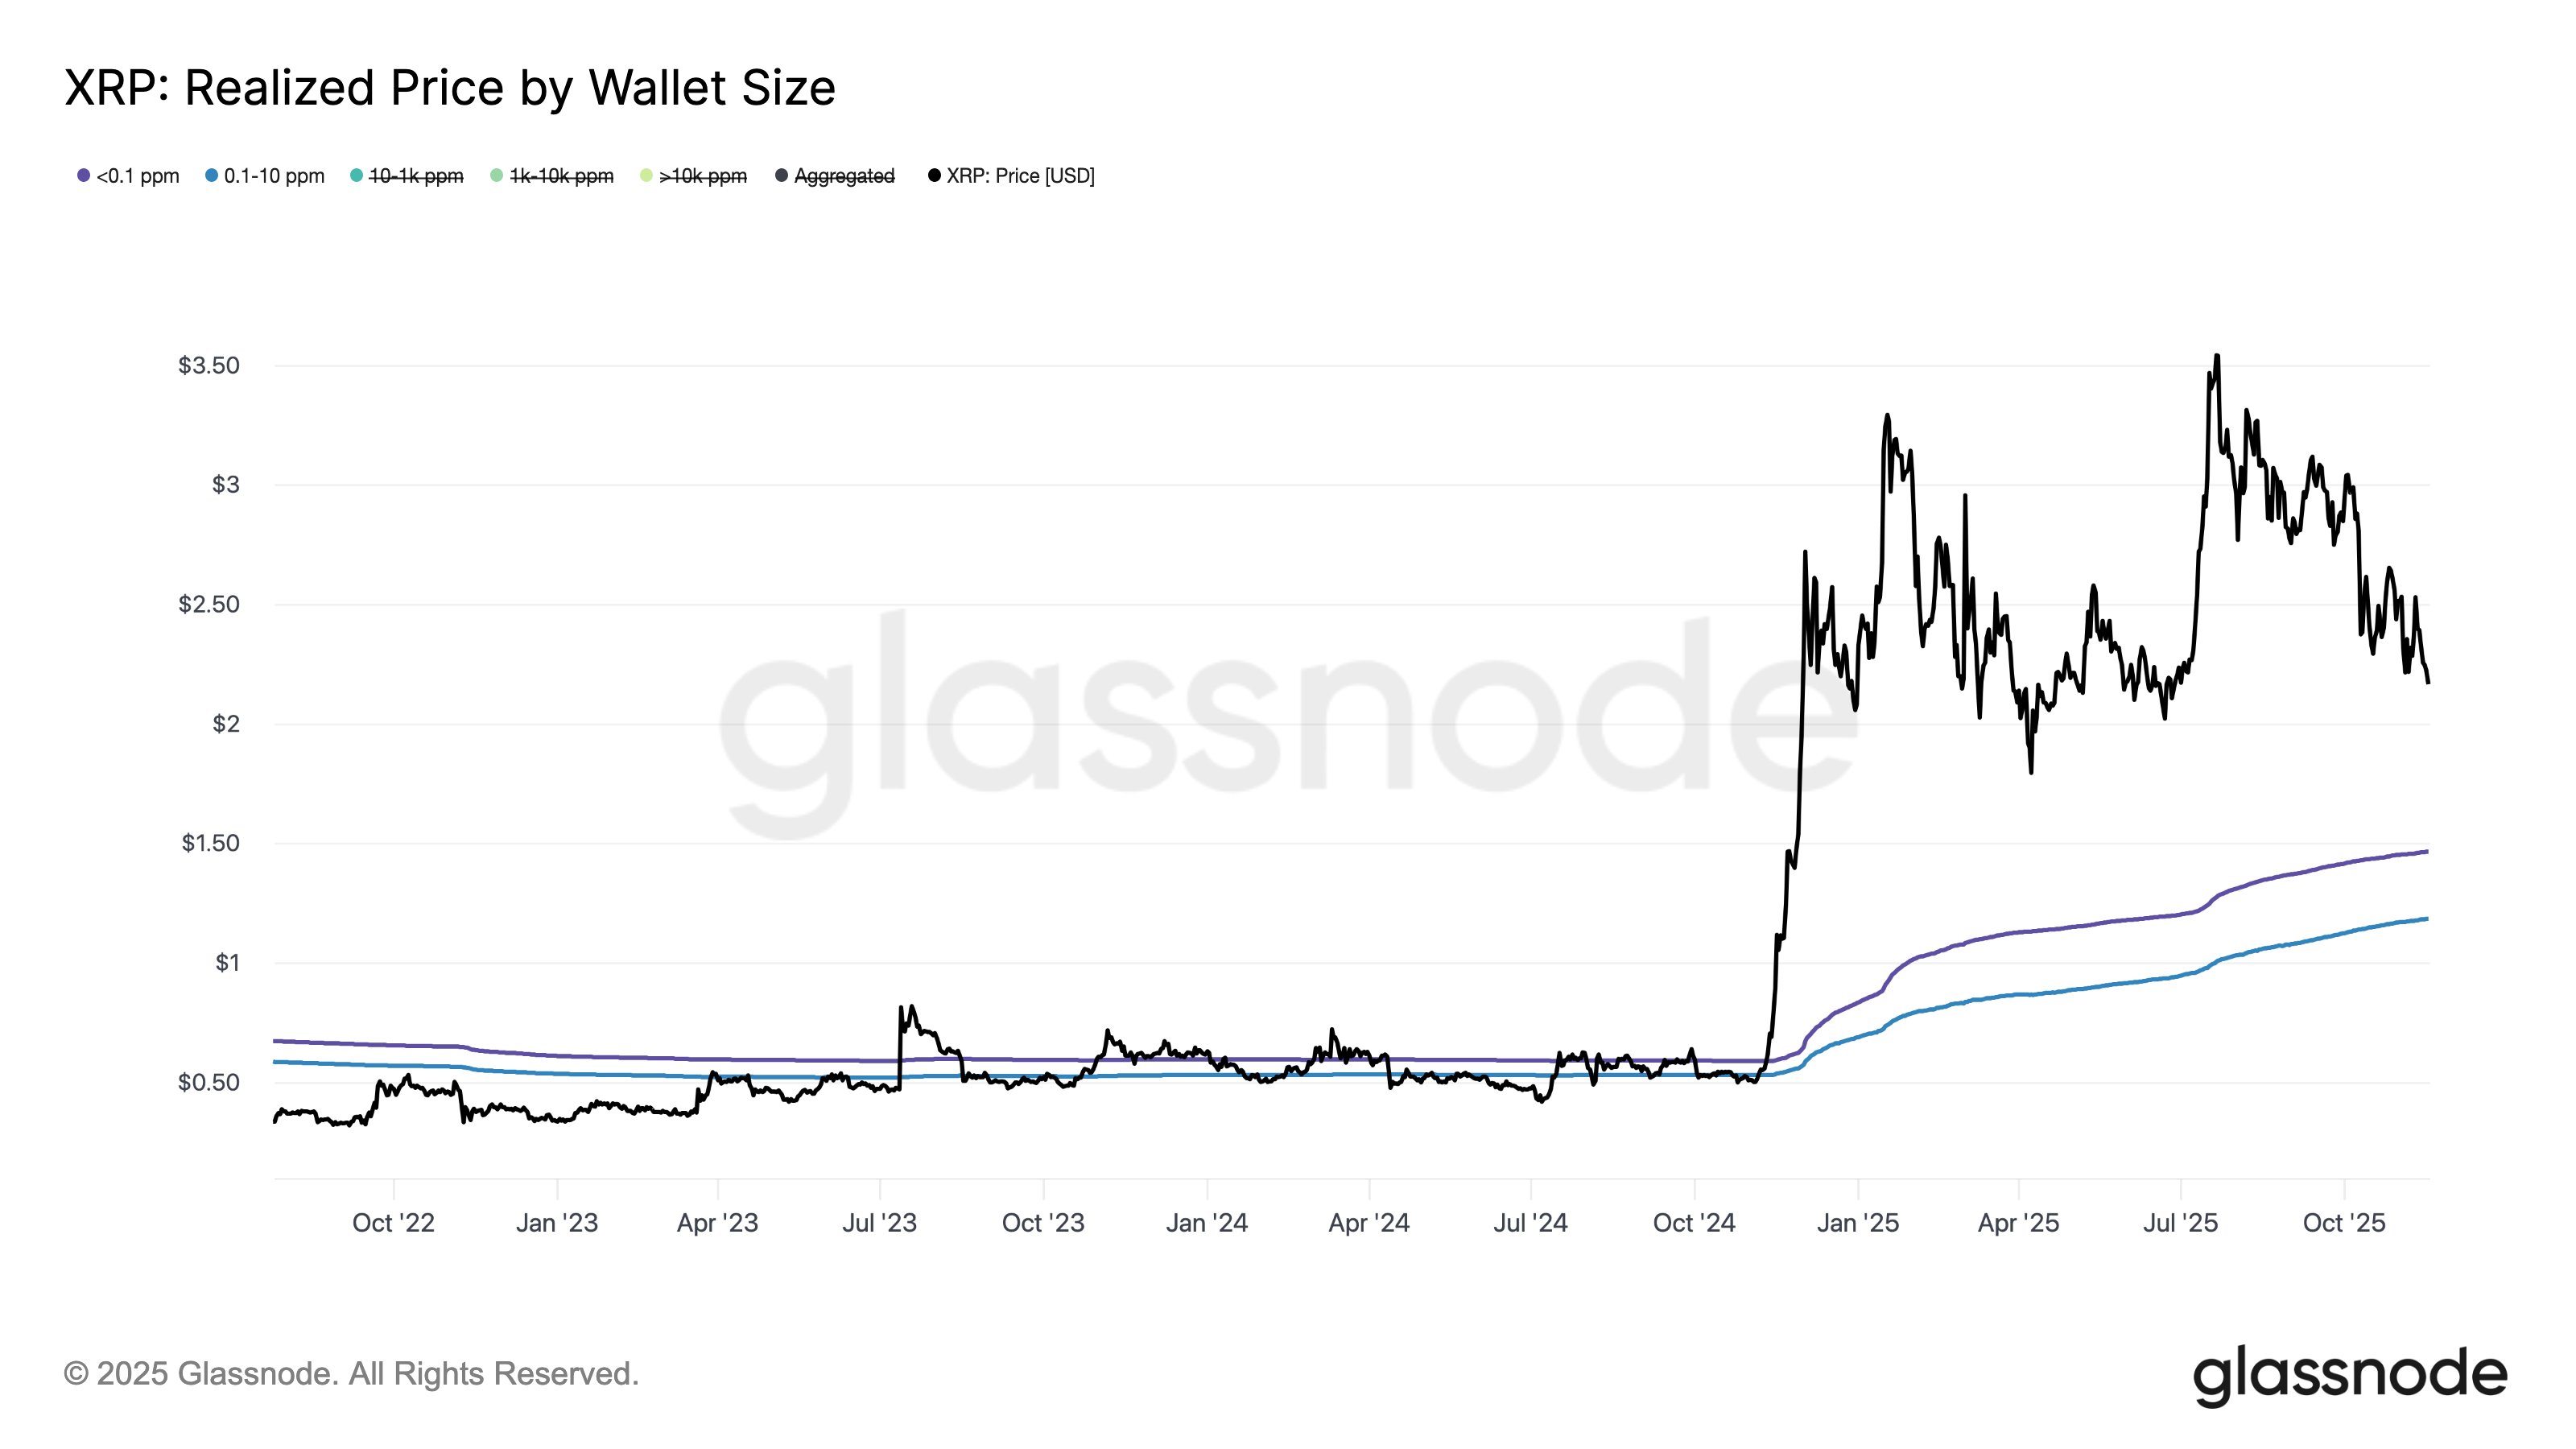
The price of the coin currently seems to be trading at a significant distance above the indicator | Source: Glassnode on X
As displayed in the above graph, XRP has witnessed bearish price action recently, but its price still has a notable gap over the Realized Price of the retail entities. More specifically, this group is in an average profit of 60% right now. Ethereum retail holders are also in the green, but their profitability isn’t quite as good, sitting at 40%.
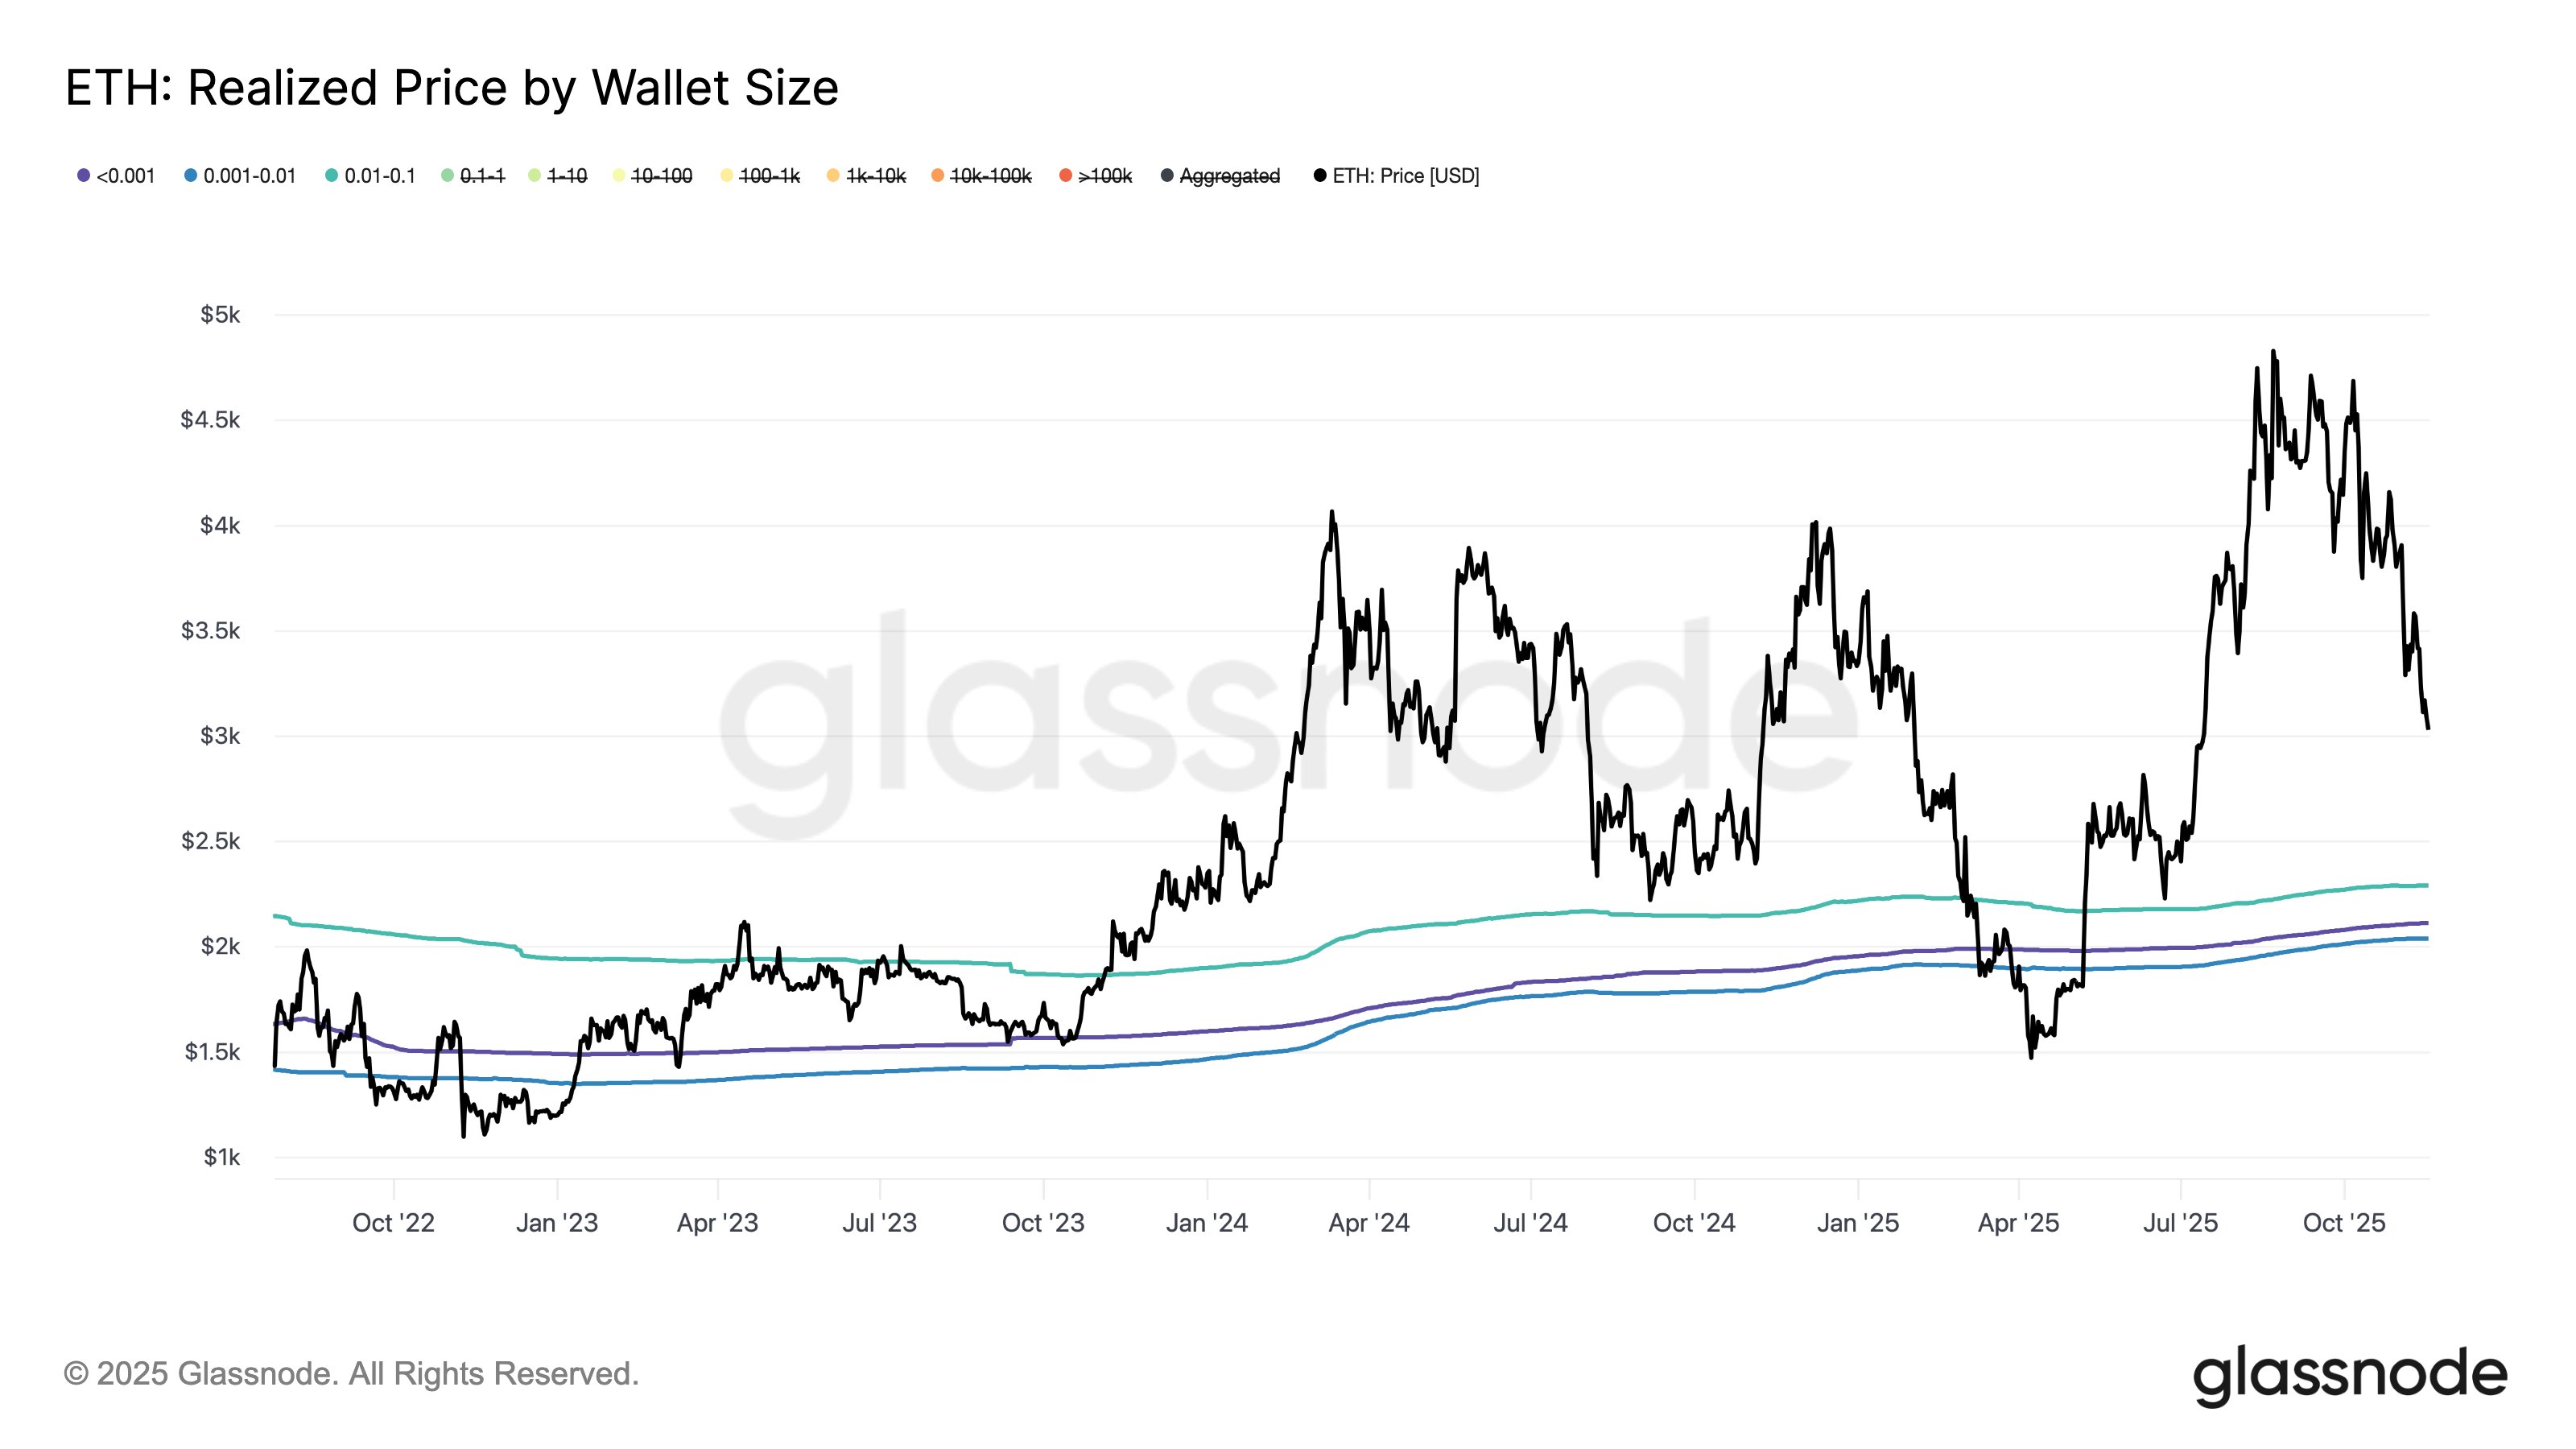
The Realized Price of the retail-sized ETH wallets | Source: Glassnode on X
Both XRP and Ethereum, however, pale in comparison to Bitcoin. Even after the price crash, BTC retail addresses are still in an average profit of more than 100%.
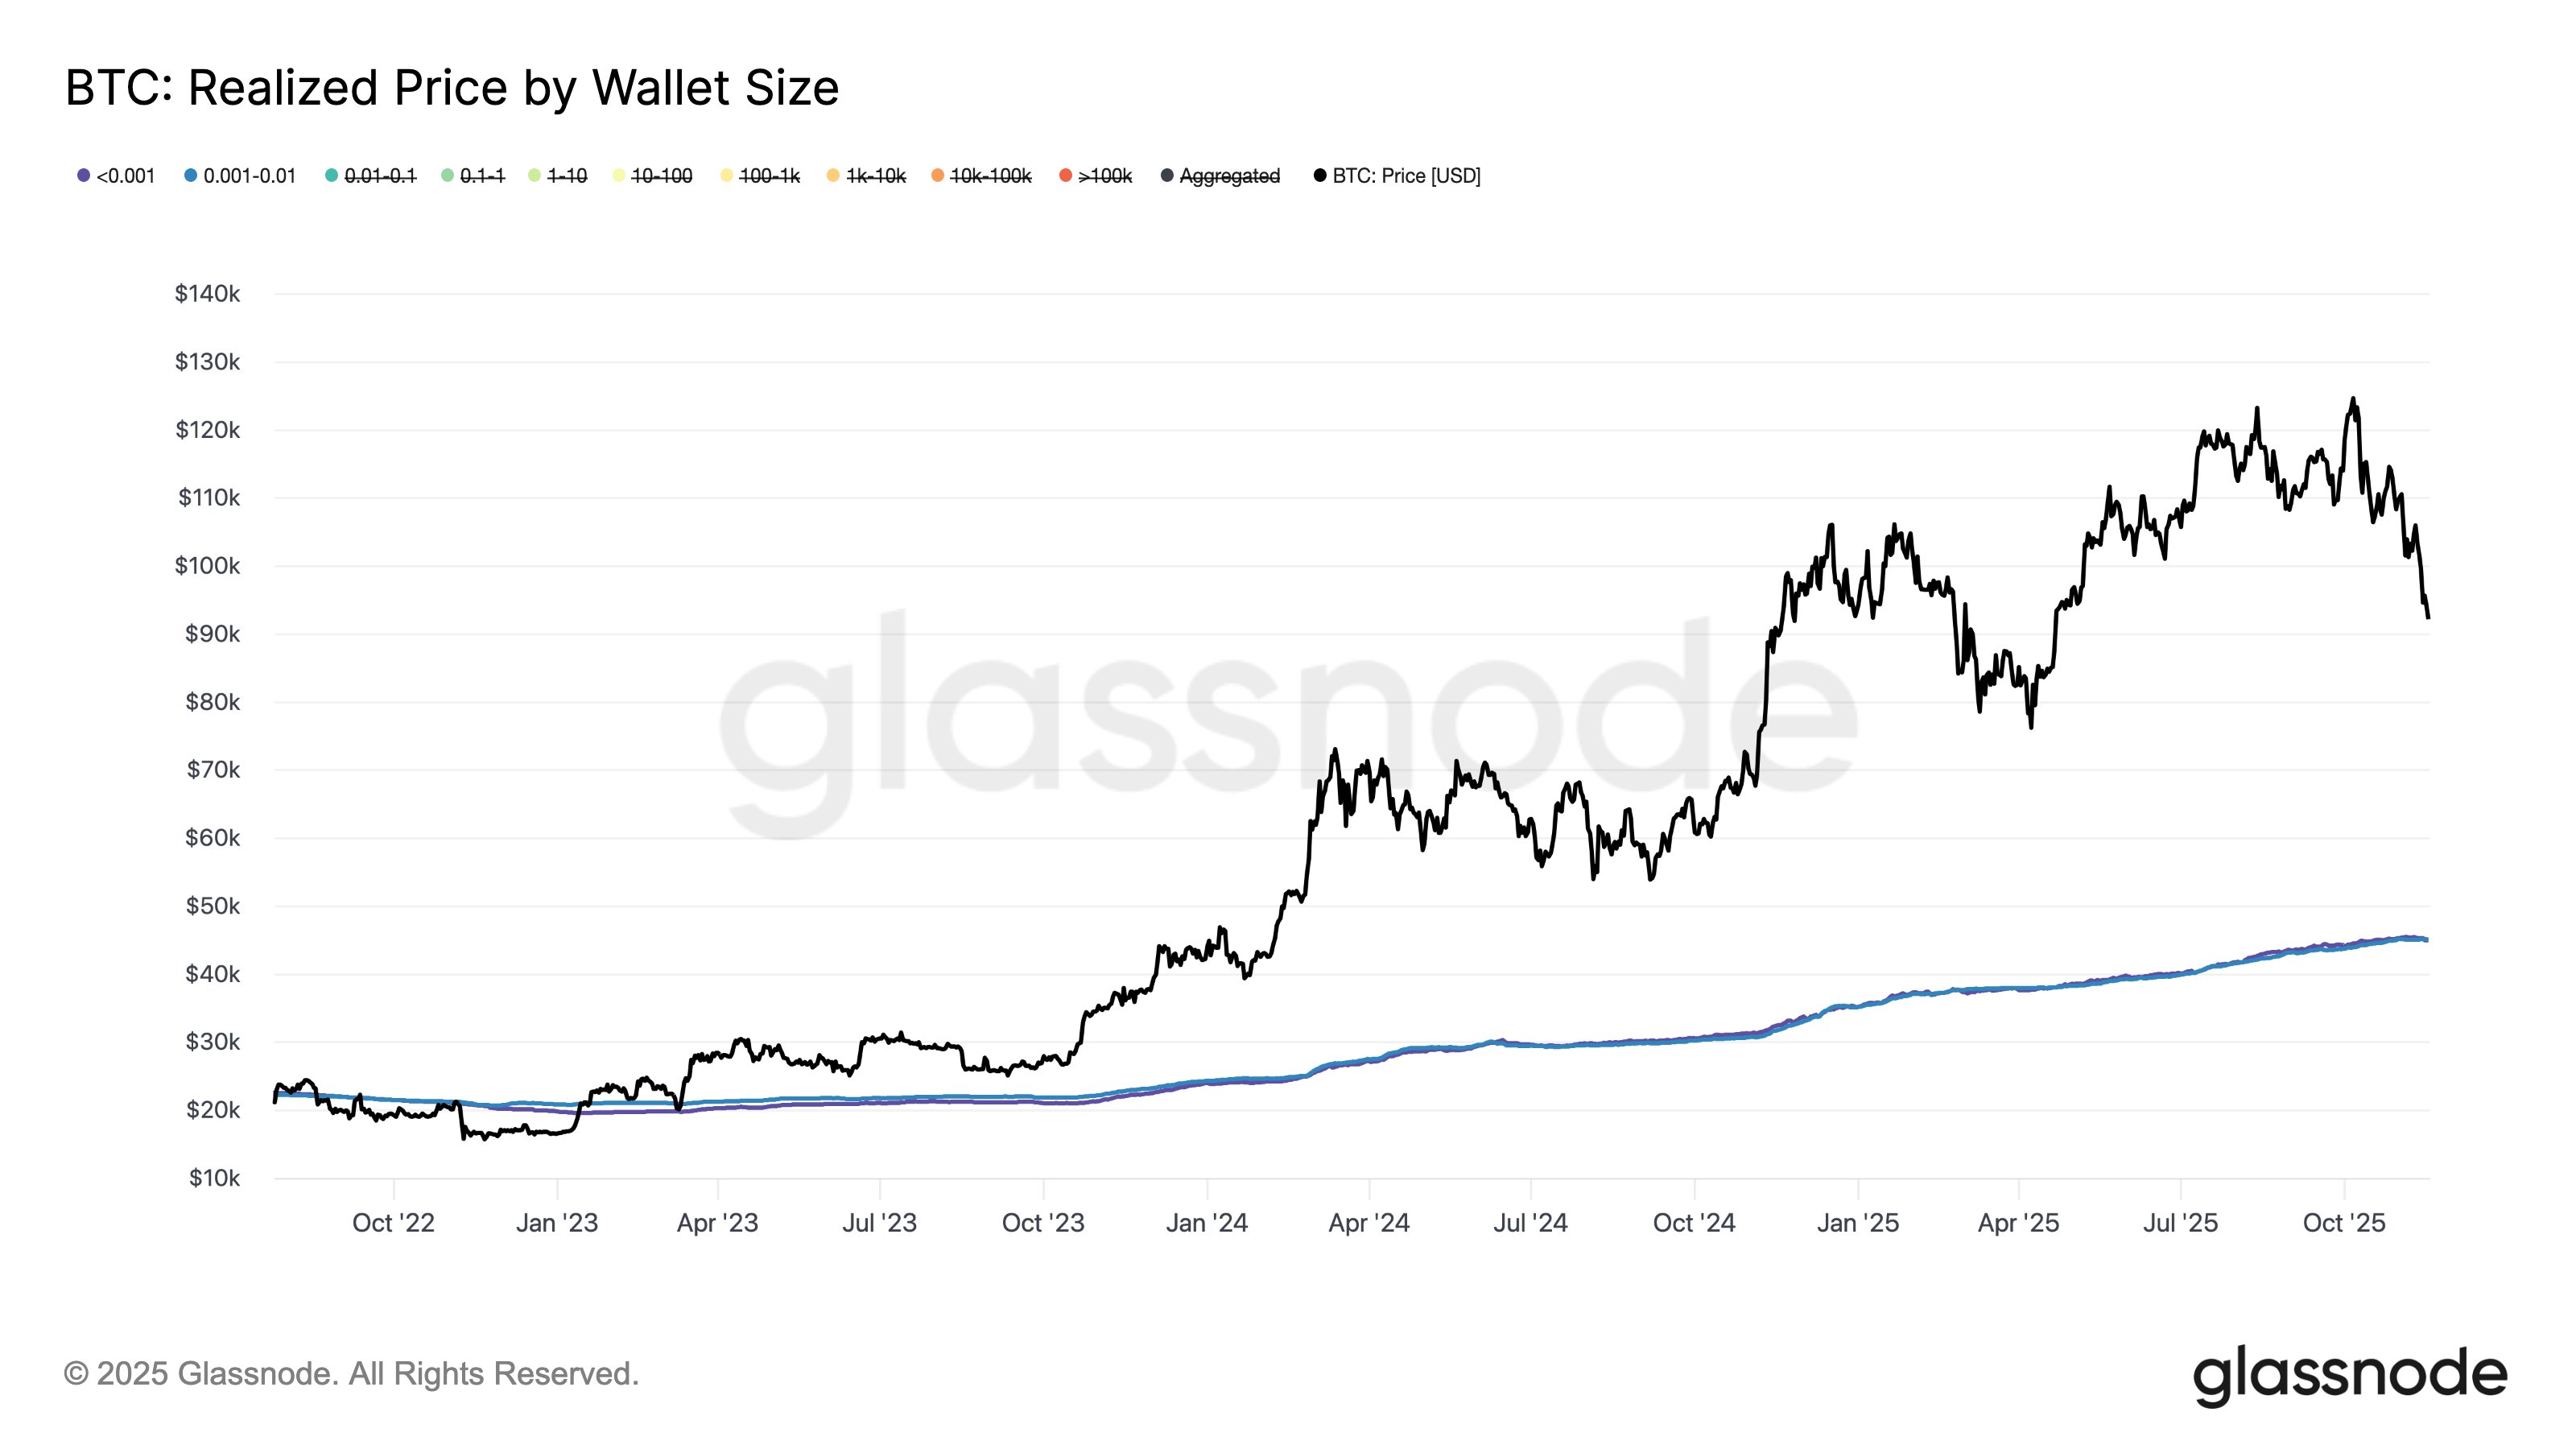
Looks like the Realized Price of BTC retail investors is quite low | Source: Glassnode on X
Now, what are retail investors doing with their profits? On-chain analytics firm Santiment has shed light on the matter in an X post. As the chart below for the holdings of this cohort shows, selling has occurred on all three networks recently.

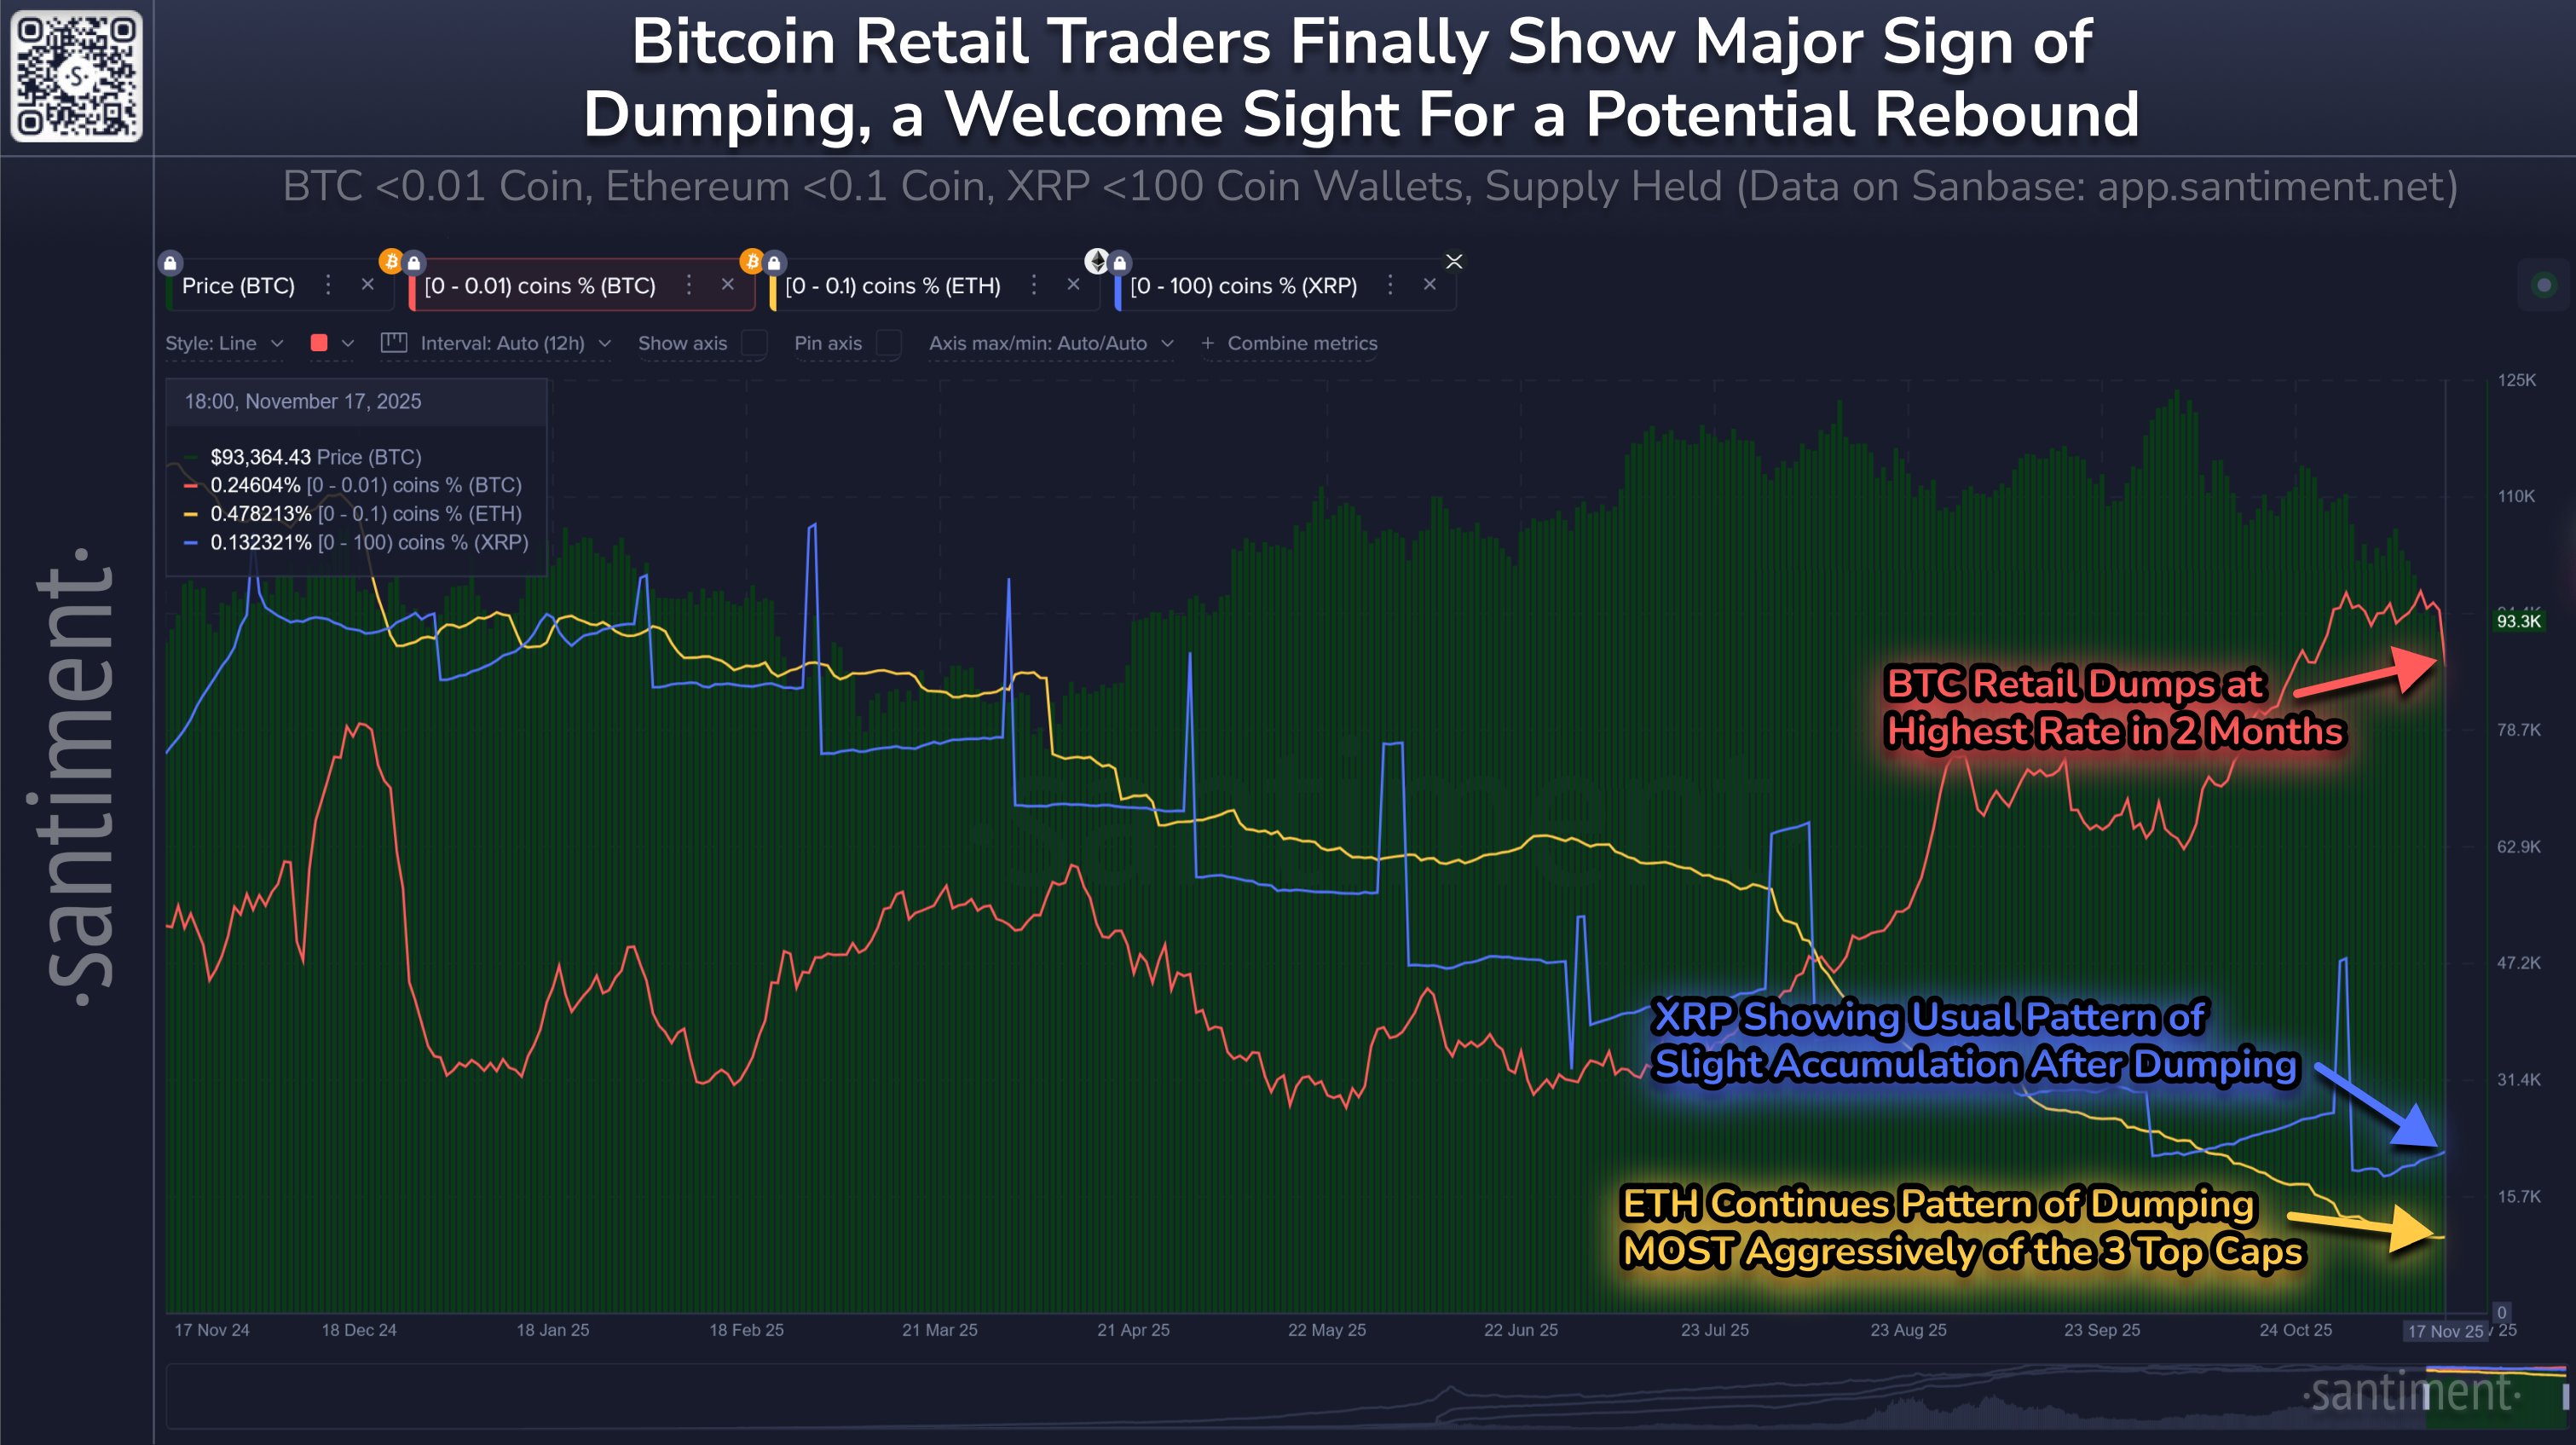
How the percentage of supply held by retail investors has changed on the XRP, BTC, and ETH blockchains | Source: Santiment on X
Bitcoin retail was accumulating until the latest price plunge, but this bearish wave has spooked them into selling 0.36% of their supply over the last five days, which is the highest rate of distribution in two months. Ethereum retail has been exiting for a while now, and the trend has only continued during the past month as the cohort’s holdings have gone down by 0.90%. XRP’s small hands have shown a more mixed behavior, first participating in a sharp selloff, and then following on with slight accumulation. Overall, the group’s supply is down 1.38% since the start of November.
“Prices move the opposite direction of small wallets’ behavior,” noted Santiment. “So we’re keeping an eye on retail traders continuing to panic sell as a positive sign for crypto’s recovery.”
XRP Price
XRP has fallen alongside the rest of the market as its price has returned to $2.13.

The trend in the price of the coin over the last month | Source: XRPUSDT on TradingView