The Bitcoin (BTC) price action is once again under scrutiny as historical indicators that preceded past All-Time Highs (ATHs) have reappeared. A recently published Bitcoin “cheat code,” by a crypto strategist, points to cyclical markers that have perfectly aligned with every major rally in the past. With BTC currently trading above $112,500, traders are watching closely as the same setup that triggered explosive runs in previous bull markets comes back into play.
A Closer Look At The Bitcoin “Cheat Code”
Crypto strategist, CrypFlow, shared a new technical analysis of Bitcoin in an X social media post on Monday. The analysis focuses on the Bitcoin (2M) SNAB Relative Strength Index (RSI) chart, which he describes as the core “cheat code” for identifying cycle tops and bottoms. He explained that the 73 level on this indicator has been the heartbeat of every major Bitcoin bull market move since 2013.
When the RSI is below 73, it has historically acted as resistance, preventing BTC from moving higher. But once Bitcoin reclaimed that level, the RSI transformed into powerful support, triggering massive rallies that culminated in new all-time highs. Every cycle from 2013, 2017, and 2021 followed the same rhythm: a reclaim of the 73 level, a sustained rally to fresh highs, and eventually a breakdown from the extreme purple line near the 98 level that signaled the ultimate cycle top.
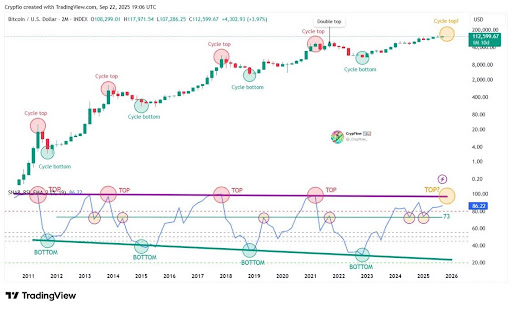
CrypFlow stated that the current market cycle appears to be repeating this pattern, with the same SNAB RSI indicator flashing for Bitcoin. After previously forming a double bottom, the cryptocurrency surged to reclaim the critical level, mirroring setups from past bull market cycles. Looking ahead, the crypto strategist confirms that BTC is yet to reach its final cycle top, despite its record-breaking run and new ATH this year.
As with past bull cycles, the final exhaustion point is expected only when RSI loses strength from its overheated levels near 98. Until then, the analyst’s confidence in his Bitcoin cheat code remains high, with signals still pointing to significant upside potential.
Bollinger Band Squeeze And RSI Cross Spark Momentum Setup
In a follow-up analysis, CrypFlow highlighted another recurring chart signal—the Bitcoin (1W) Bollinger Bands squeeze combined with a bullish stochastic RSI cross. This pairing has reportedly been a reliable trigger point for Bitcoin’s upward momentum throughout the current cycle.
Historically, the pattern begins when the Bollinger Bands tighten around the price, indicating reduced volatility and an increased likelihood of a breakout. Each time this squeeze has coincided with a bullish stochastic RSI cross, CryptoFlow notes that Bitcoin has launched into a fresh upward swing. This was the case during previous surges from mid-2023 through 2025, with each squeeze setting the stage for significant price rallies.
Right now, the setup is flashing once again. CrypFlow highlights that Bollinger Bands have compressed, and the stochastic RSI has just confirmed another bullish cross. He argues that this setup has held throughout the current cycle, and its reappearance signals that momentum is about to accelerate once again. If history repeats, BTC may be on the verge of another explosive squeeze that drives it to fresh ATHs.