

Ethereum has been on an impressive rally over the past month.
The leading altcoin is trading up more than 16% in the past month, as per data from crypto market site Coin360.com. Over that same time frame, Bitcoin dropped by 4%, while certain altcoins like XRP and BSV plunged by nearly 10%.
While many have seen this as bullish, analysts are starting to fear that a correction is on the horizon. They cite a confluence of technical analysis trends.
Related Reading: Yesterday, Ethereum Miners Received 60% More Fees Than Bitcoin Miners
Ethereum Could Correct In the Coming Days, Analysts Assert
According to Elliot Wave analyst Oye Beto, Ethereum is currently showing signs it remains in a corrective pattern slated to take it towards $220.


Elliot Wave analysis, for those unaware, is described by Investopedia as the following:
“Elliott Wave Theory is a method of technical analysis that looks for redcurrant long-term price patterns related to persistent changes in investor sentiment and psychology.”
It isn’t only Oye Beto that is bearish on Ethereum.
A pseudonymous trader noted that investors in the asset shouldn’t “cry when the storm hits,” referencing the chart below.
The chart shows that ETH is printing two crucial signals it is about to reverse to the downside:
- 1) the TD Sequential indicator is currently on a “9” candle, most often seen at trend reversals (look at the red candles in the chart below);
- 2) the price was rejected at a downtrend that has constrained price action for the past few months.

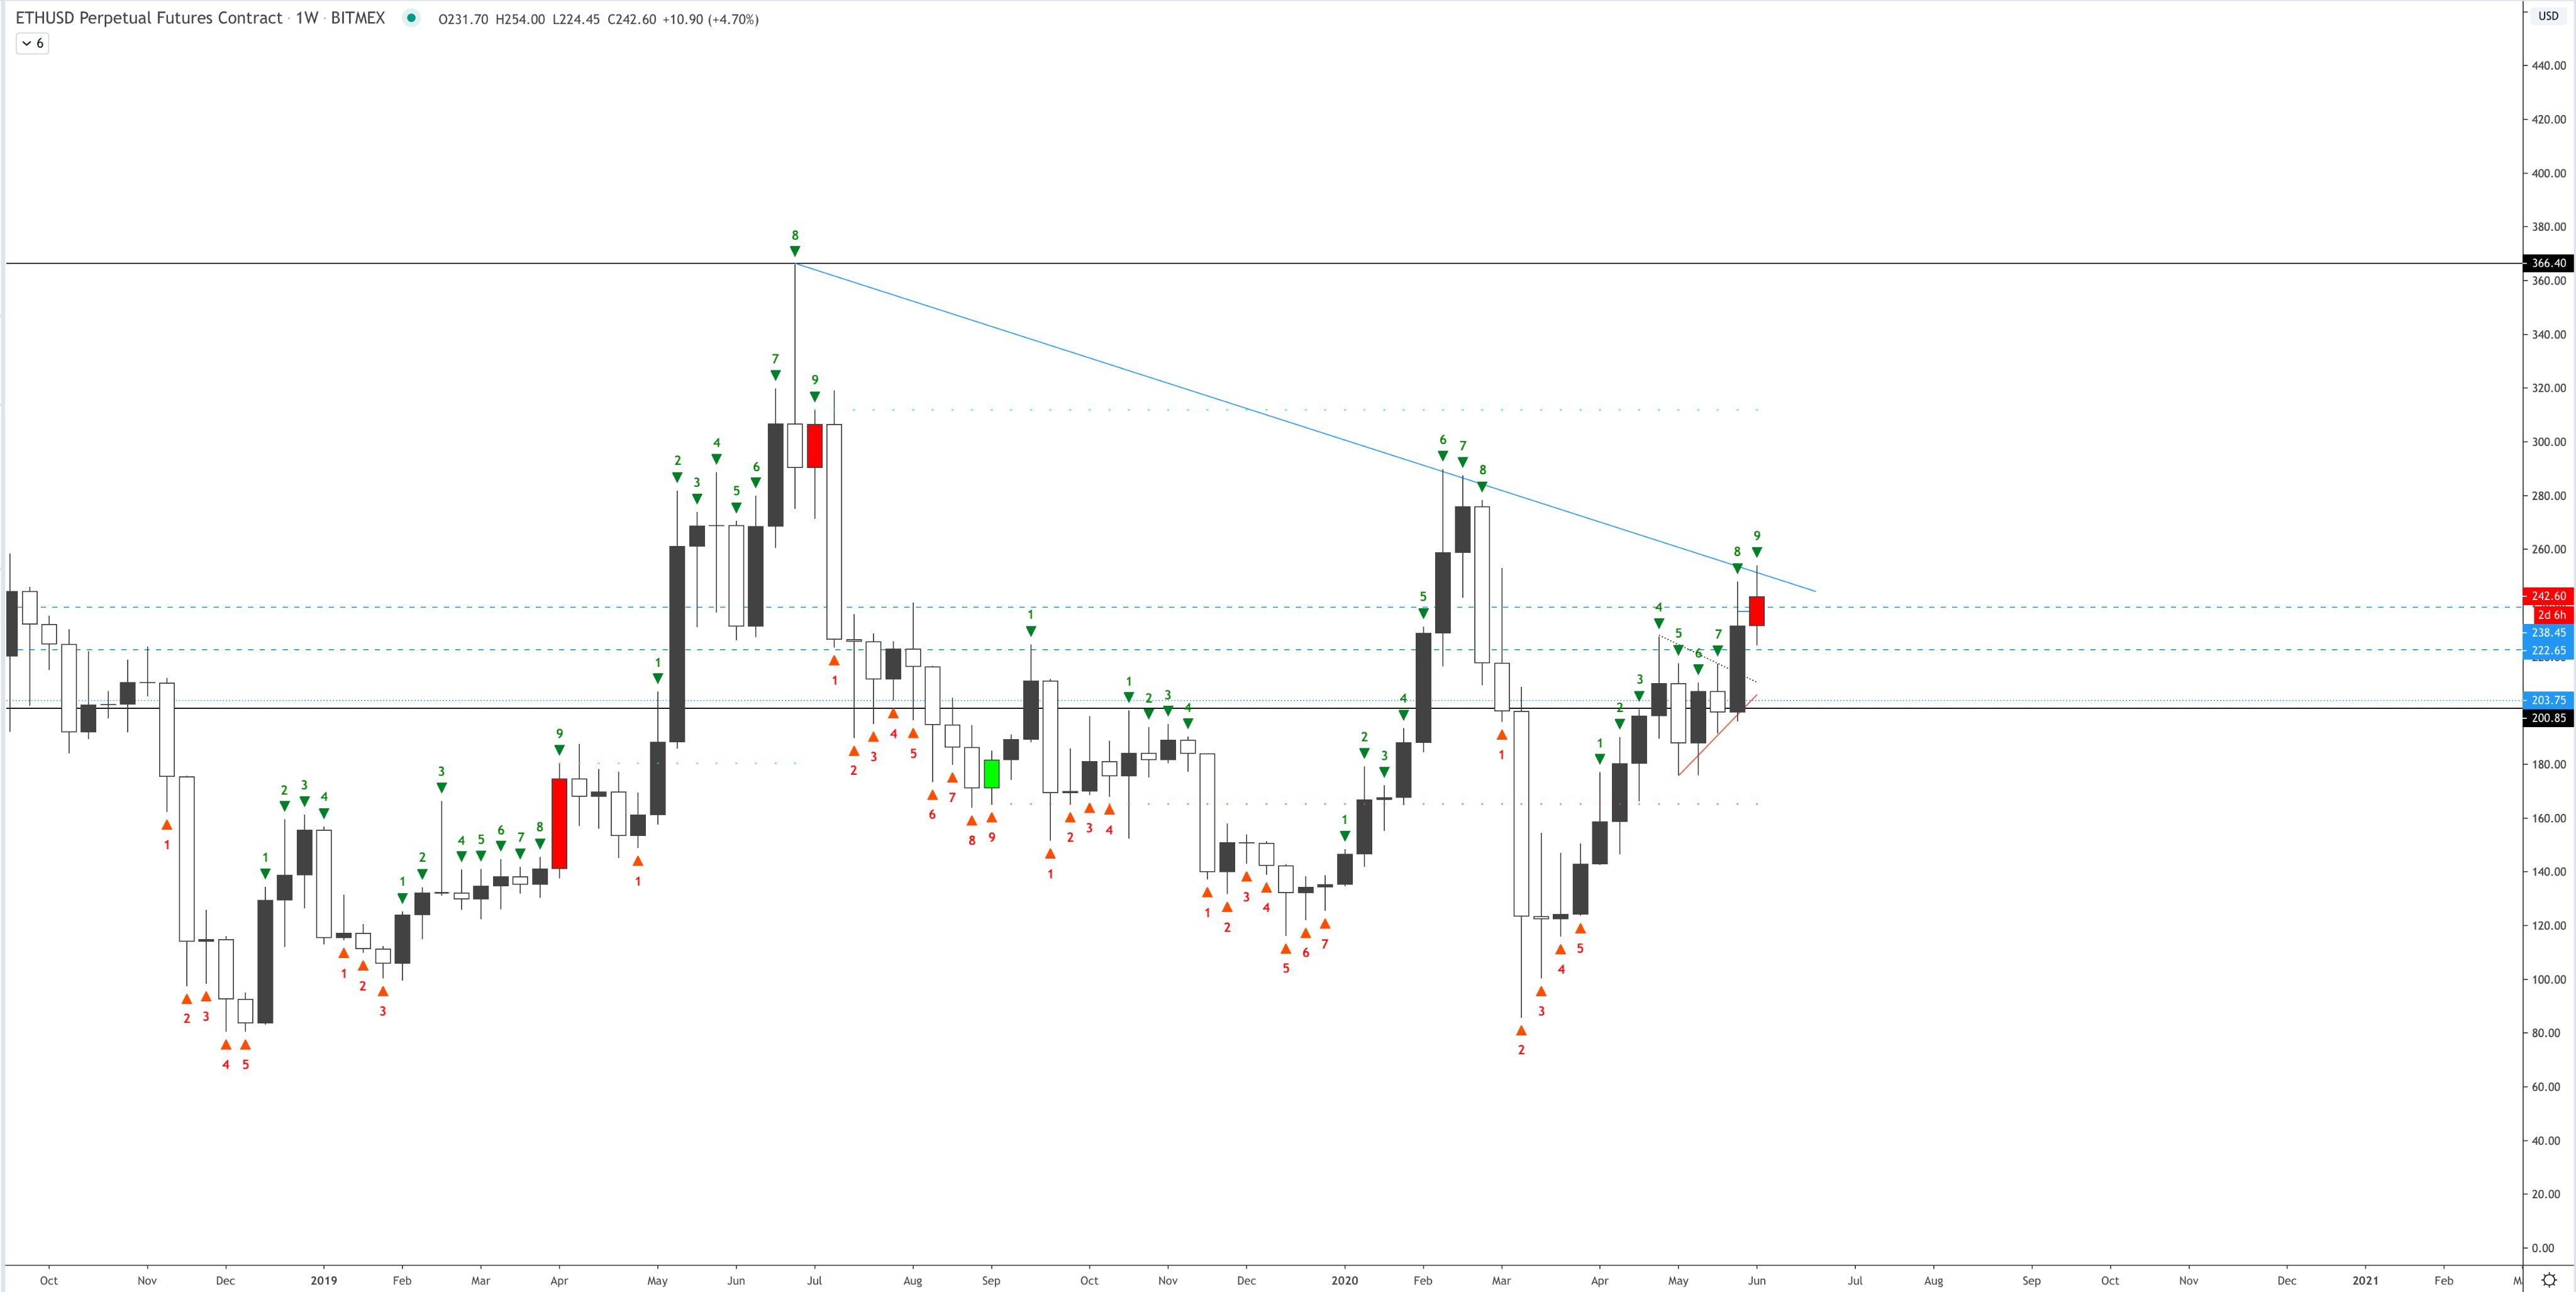
Notably, the trader did not note where he expects the cryptocurrency to trend towards, but he did identify $200 as a key level to watch, noting how it has acted as an inflection point for this market over the past two years.
Related Reading: XRP, the “Weakest” of the Top 10 Cryptocurrencies, Could Soon Dump 20%: Analyst
It Will Fall Also Bitcoin Too
Ethereum may underperform Bitcoin as well.
Per previous reports from Bitcoinist, the analyst that in the middle of 2018 predicted Bitcoin would bottom at $3,200, recently shared the chart seen below with the following comment:
“This is what i think ethbtc does. short term bullish so will outperform btc for a few days (means ethusd will moon) after it makes a new high above 26000 sats i think it will top.”

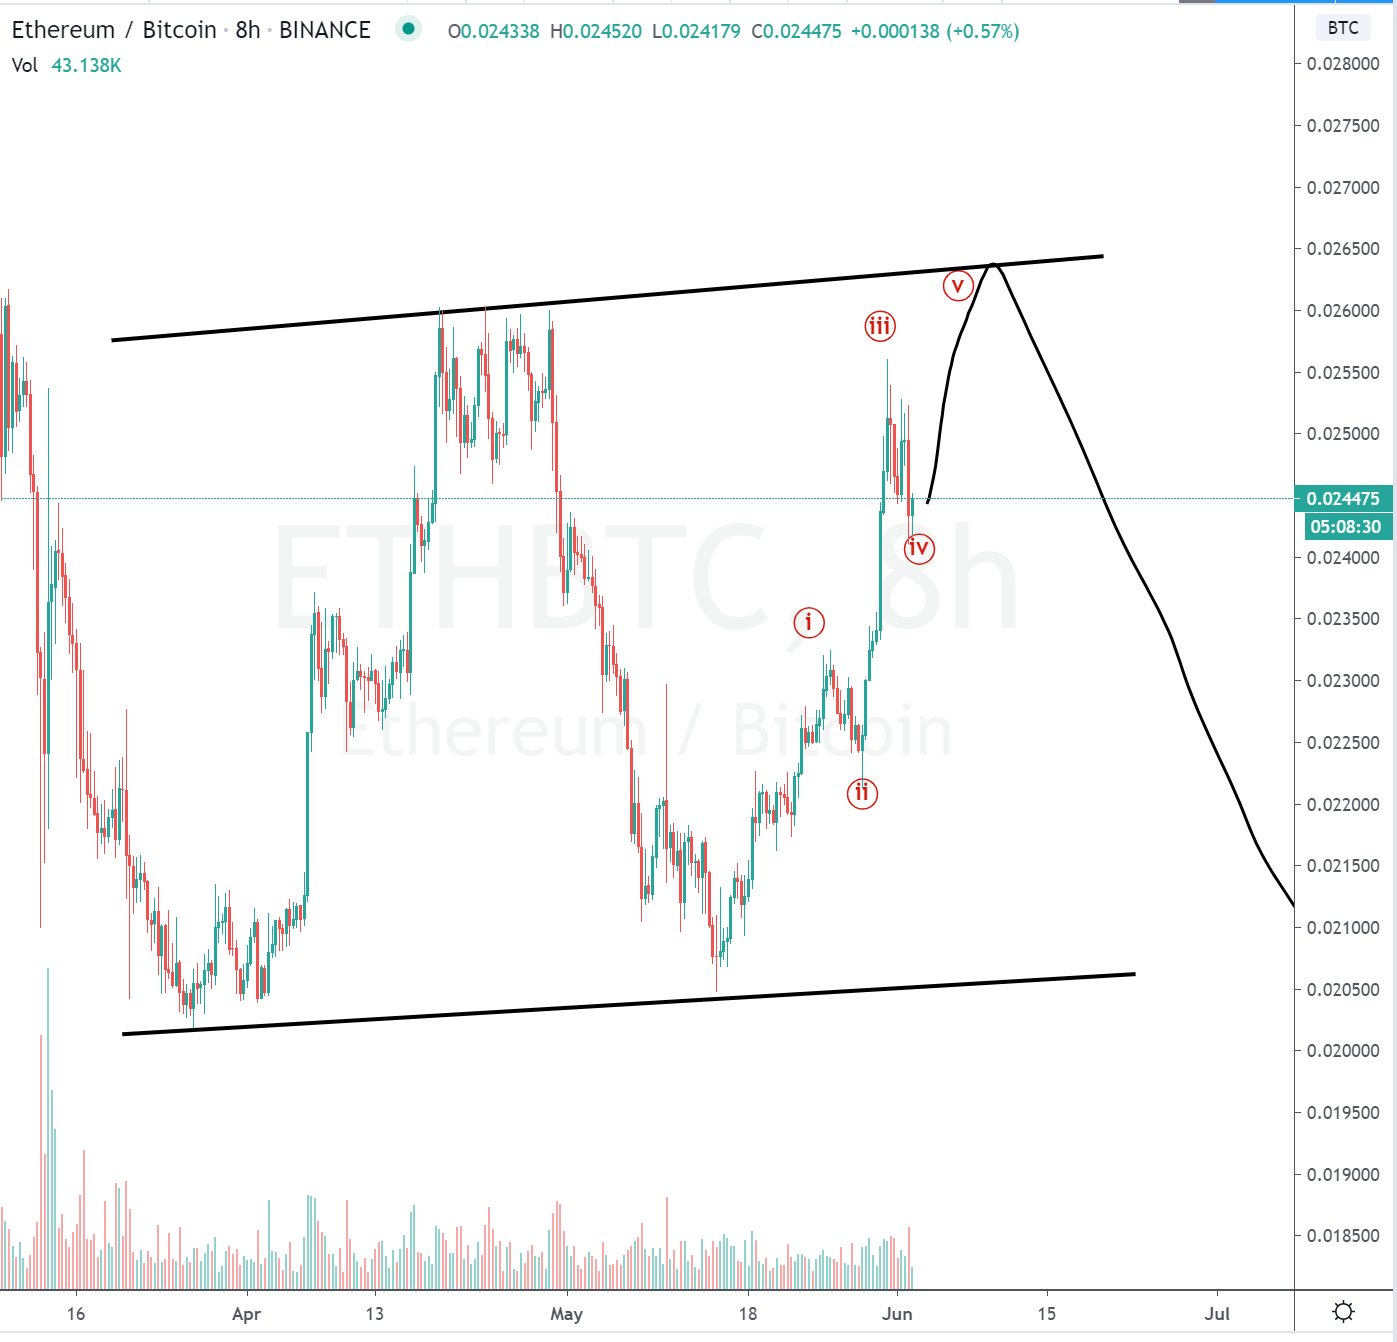
The confluence of bearish signs seen on the ETH/BTC and ETH/USD charts suggests that the altcoin’s prospects are truly poor, especially considering how the crypto narrative remains focused on Bitcoin.
Featured Image from Shutterstock
Price tags: ethusd, ethbtc
Analysts Are Fearing an Ethereum Correction: Here's How Fall It Could Fall