

While Bitcoin’s price has declined sharply from its recent all-time high of $124,000, the development has caused a wave of concerns and uncertainty within the community. Several metrics are starting to reflect this waning sentiment among investors toward the largest cryptocurrency asset.
A Cooling Accumulation Bitcoin Trend Score
When a crypto asset’s price experiences a persistent downward trend, history reveals that the negative movement mostly hampers investors’ sentiment. The same can be said for Bitcoin, with the current state of its market and the action of investors toward BTC’s recent price pullback.
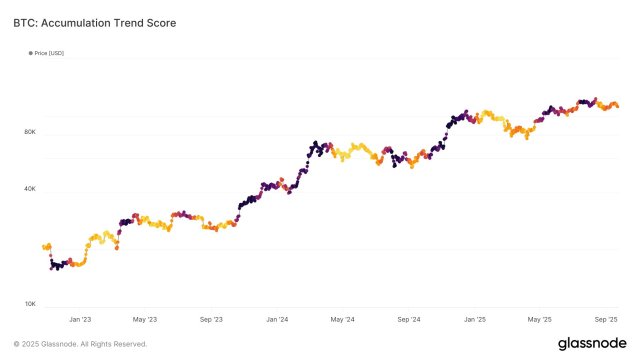
Following an examination of the Bitcoin Accumulation Trend Score, Glassnode, a leading financial and on-chain analytics platform, revealed that the metric is showing signs of weakness. This cooling period in the crucial metric indicates that large and long-term BTC investors are reducing their aggressive purchasing habits.
According to the on-chain platform, the BTC accumulation trend score has softened with conviction from large cohorts despite elevated costs. Even though the indicator still demonstrates healthy levels of holding, the recent softening points to a break in the surge of accumulation that may have been boosting the market uptrend and confidence.

Such a change currently may signal a transitory stage in which institutions and whales reevaluate their positions in light of altered sentiment toward cryptocurrencies and changing macroeconomic periods.
Glassnode highlighted that a more cautious bid is frequently indicated by lighter accumulation. At the end, this cautious trend leaves the BTC market susceptible to a supply overhang until demand picks up speed once again.
Market Eyes Shift As BTC Exchange Inflows Drop
Investors’ conviction in Bitcoin has not yet fully faded, as evidenced by a drop in BTC total Inflows to all crypto exchanges. In a quick-take post on the CryptoQuant platform, Nino, a market expert, claims that the declining BTC exchange inflows hint at a possible shift in market dynamics and sentiment.
Nino determined the continuous decline using the 7-day Moving Average (MA) time frame. Given the present market state, the expert noted that this trend could be explained in multiple ways. When there is a high influx, it often points to potential selling pressure, and derivative markets face a more complex situation than spot exchanges.
Furthermore, a surge in inflows may not necessarily imply a clear market direction but rather the potential for future high volatility due to the fact that the funds can be used to open both long and short positions. As a result, the declining inflow might suggest a rising confidence among holders to retain their assets off exchanges. Considering the trend, a short-term supply reduction becomes highly likely.
At the time of writing, BTC was trading at $109,492, showing a nearly 2% drop within the last 24 hours. Despite the fading momentum, its trading volume in the past day has increased by over 36%, indicating a gradual resurgence in bullish bets.
