Bitcoin has lost more than 35% of its value since early October, dropping sharply from its $126,000 all-time high and sending the market into full panic mode. Sentiment has deteriorated quickly, with liquidations, forced selling, and collapsing confidence pushing price action into deeply oversold territory.
Most analysts now argue that Bitcoin has officially entered a bear market, pointing to structural breakdowns and the violent rejection from cycle highs. However, a smaller but vocal group of market participants still believes the cycle is not over, claiming that the recent crash reflects capitulation—not long-term exhaustion.
Supporting this view, key on-chain data from analyst Darkfost highlights a critical signal: the BTC NVT Golden Cross. This indicator evaluates Bitcoin’s valuation relative to its transactional and on-chain activity. Darkfost notes that when the NVT Golden Cross drops below –1.6, Bitcoin historically becomes undervalued, often preceding sharp mean-reversion rallies and major recovery points.
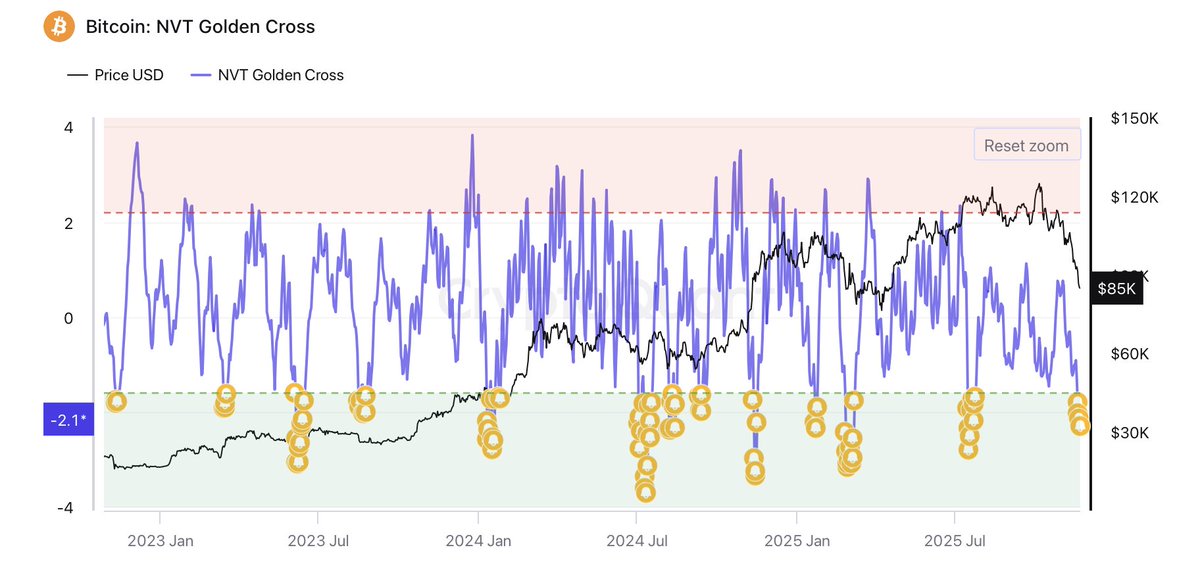
With the indicator now approaching this oversold threshold again, some see this collapse as a potentially attractive long opportunity rather than the beginning of a prolonged downturn.
Bitcoin NVT Golden Cross Signals Opportunity, but Risks Remain Elevated
Darkfost explains that the current NVT Golden Cross reading has triggered a preset alert designed specifically to identify short-term opportunities. Historically, when this indicator dives into deeply negative territory, it often aligns with moments when Bitcoin becomes temporarily undervalued relative to its on-chain activity.
Traders frequently use these signals to establish long positions or accumulate spot BTC at discounted levels. However, Darkfost also cautions that this is far from a perfect signal. It works best during healthy market structures, not during periods of aggressive macro stress or cascading liquidations.
The present environment is one of the most challenging of the cycle. Liquidity has thinned, volatility has exploded, and systemic fear dominates behavior across Bitcoin, altcoins, and risk assets globally. Under these conditions, Darkfost warns that leverage should be avoided entirely. Even historically reliable signals lose accuracy when price action becomes disorderly, and sharp intraday swings can invalidate setups within hours.
The coming days will be decisive. Investors are watching closely to see whether Bitcoin can stabilize above local support and form a base—or whether selling pressure will extend, confirming the bearish thesis. Either way, the next move is likely to define the market’s trajectory heading into year-end.
Testing Deep Support After a Sharp Breakdown
Bitcoin’s 3-day chart shows a market fighting to stabilize after one of the steepest corrections of this cycle. Price has tumbled from the $126K peak in early October to the $86K region, briefly tagging liquidity below $85K before rebounding.

The structure now reflects heavy downside momentum: BTC has broken below both the 50-day and 100-day moving averages, flipping them into resistance. The 200-day moving average — currently sitting near $88K — is now acting as a critical dynamic support level and the last major line before deeper structural damage.
What stands out most is the surge in volume accompanying this decline, confirming aggressive selling rather than a low-liquidity drift. This aligns with the broader capitulation narrative seen across on-chain metrics. Candle structure signals exhaustion on the downside, with long lower wicks showing buyers stepping in near key liquidity zones.
However, BTC remains in a vulnerable position: any daily close below the 200-day moving average risks opening the door to a deeper slide toward the $78K–$80K region.
For bulls, reclaiming $90K is essential to shift momentum and invalidate a cascading lower-high, lower-low sequence. Until then, the chart signals caution — but also the potential for a short-term relief rally if buyers defend current levels.
Featured image from ChatGPT, chart from TradingView.com