
Bitcoin price has been consolidating in an ever-tightening range between its current all-time high around $42,000 and a low of nearly $28,000. But could a new all-time high be only days away? The CEO of a capital management firm believes so, and has shared chart demonstrating a clear technical breakout in the top cryptocurrency by market cap.
Here’s a closer look at the current price action and potential upside targets.
Bitcoin To Reach New All-Time High In Days Or Weeks, Following Technical Breakout
Although it was the narrative and perfect storm scenario of 2020 that brought Bitcoin into the financial world spotlight, 2021 is proving to be the year of Bitcoin.
FOMO is spreading like wildfire, and participants now range from retail to corporate CEOs, institutions, and other high net worth individuals. Celebrities are acting as an echo chamber, and mainstream media is furthering the frenzy with outrageous headlines featuring claims of valuations reaching hundreds of thousands of dollars per coin.
RELATED READING | GRAYSCALE FOUNDER EXPECTS “A TIDAL WAVE OF CAPITAL” TO FLOW INTO CRYPTO
Outrageous as they may seem, the cryptocurrency is known to go parabolic every four years and each phase of mark up has been more shocking than the next. The first major rise took Bitcoin to $1,200, and in 2017 it reached $20,000. The current all-time high is set at $42,000, but according to a capital manager focusing on Bitcoin in some recent tweets, another new record is just “days” away in his opinion.
Vailshire Capital Management LLC founder and CEO Jeff Ross claims a bullish technical breakout has been “confirmed” and given the “wildly bullish” macro setup, Bitcoin will see new all-time highs in days or weeks.
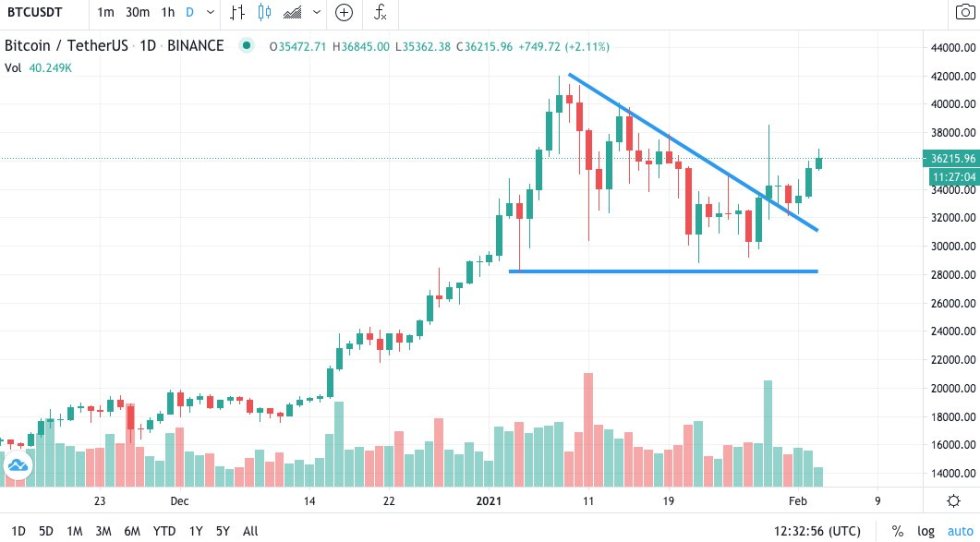

A bullish breakout has been "confirmed" according to Ross | Source: BTCUSD on TradingView.com
Ross has shared a chart depicting what appears to be a descending triangle pattern, which the top cryptocurrency has broken out from, and retested the top descending trendline as resistance turned support.
After the bullish retest held for several days, the pattern is “confirmed” according to Ross. However, technical analysis is somewhat subjective, and the typically bearish pattern itself can be drawn in such a way that might indicate that bulls aren’t yet out of the woods.
The descending triangle has been a thorn in the side of cryptocurrency investors since 2018, and have resulted in some of the most devastating downside that Bitcoin has experienced.
Could it be so simple that bulls have already breached the top trendline, or could the triangle be a bull trap in the making? Drawn differently, the top trendline is still keeping Bitcoin at bat for the time being.
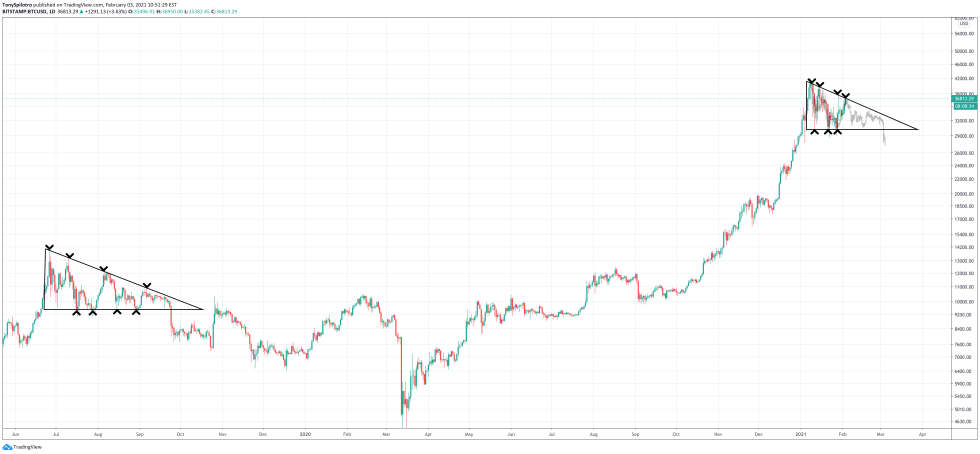

Descending triangles have not been kind to Bitcoin in the past | Source: BTCUSD on TradingView.com
The leading cryptocurrency by market cap is consolidating just below resistance on this variation of the pattern, so the price action is undeniably bullish as Ross points out.
RELATED READING | S2F PREDICTS 20% PER MONTH GROWTH RATE FOR BITCOIN IN 2021
The one factor that bulls must beware of, is the fact that the price action within the triangle, closely matches the descending triangle that marked the peak of the 2019 rally.
Featured image from Deposit Photos, Charts from TradingView.com