

Editors Note: Bitcoinist is bringing you a series of market information and trading guides by Yann Wahli of Crypto Finance Analysis Consulting
Dear trader,
Here is the second article of our Decadays Market Report series. The first one is still available here.
The last ten days have seen all resistances give way. Ten day ago, I was telling you “The coming days do not look bright, and Bitcoin could well get bellow $255 quite fast.” Well… The coming days aren’t any brighter. Now there is no resistance left, Bitcoin could fall to $100 without surprising me. In this context, some of you may want to diversify in other altcoins. Be, however, careful with this: remember the first rule mentioned in the previous article: The market is always right. The second rule is that if the price is king, the liquidity is queen.
There are numerous altcoins around, 486 listed on coinmarketcap.com. You will quite often see daily performances over 25% and will always find someone telling you: “I’ve made 500% in 3 days with that currency.” “Yeah, great! And how much did you make of it?” “Well… 500% of 0.0001 Btc = 0.0004 Btc” Yes, not even a dollar… Personally, as a trader, I concentrate on Bitcoin and a one or two altcoins. To choose my altcoins, the first thing I check is liquidity. Right there, it is possible to remove 480 out of the 486 altcoins on the list.
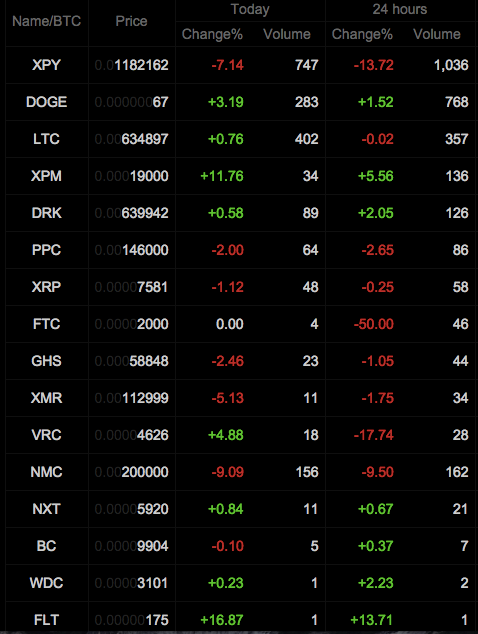
That’s why it is imperative to check the liquidity before getting down to the fundamentals of a crypto currency unless you’re in for the long term.
Today’s update on Bitcoin:
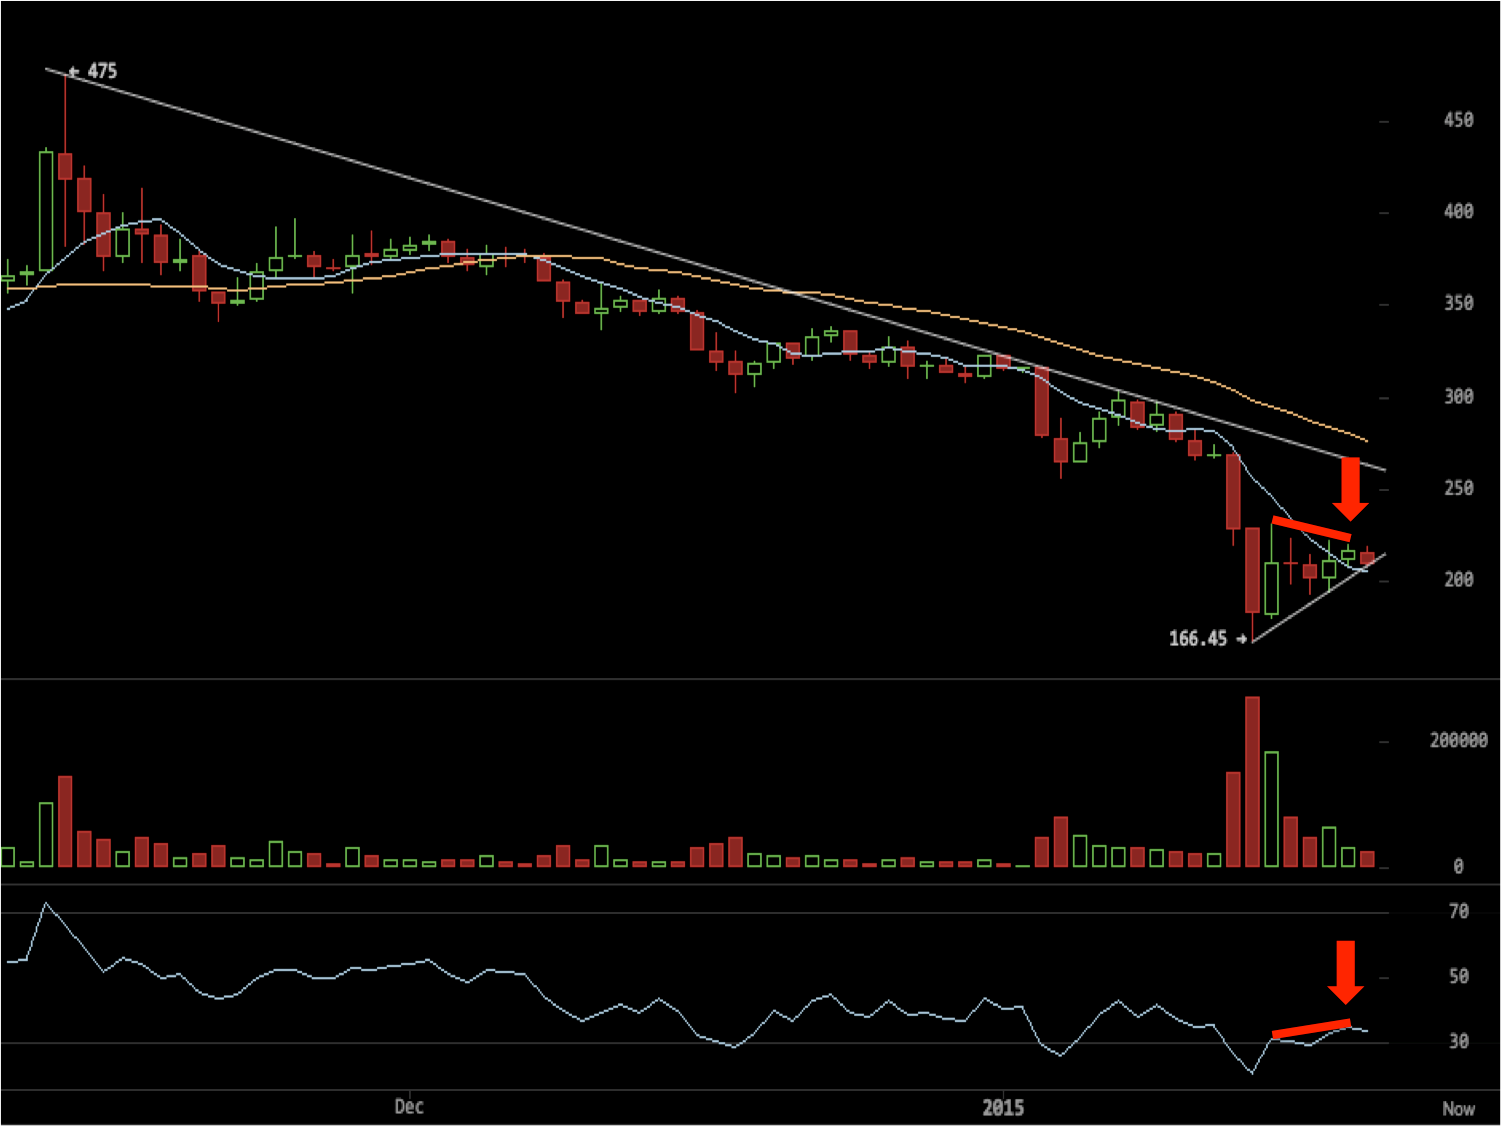
After the sudden crash of January 13th and 14th, the trend is still bearish. After the little adjustment of the past few days made in relatively low volumes, a bearish divergence (1) is forming (red arrows). So, the price of Bitcoin may not recover in the coming days. Instead, the risk is to see a new strong drop if the $166 threshold gives way.
My advice from last time doesn’t change: Those who are short, bring your stops closer (in the $235-$239 zone) and start putting in place an exit strategy and of the profit taking. Those who are waiting to be able to enter the Bitcoin market, be patient and put your emotions aside.
Good trading,
(1) Bearish divergences are noticed during a bearish trend. To bring out, like here, a bearish divergence during a bearish trend, one must compare summits from the Relative Strength Index. (RFI, very bottom of the chart) Compare those from the prices (top of the chart). We have a bearish divergence when the indicator is making news highs while the prices’ highs get lower and lower. In this case, we deduce that the bearish trend is strong.
Yann Wahli
Manager of the Cryptocoins hedge fund
CFO of Crypto Finance Analysis Consulting
Photo Credit: coinmarketcap.com, Featured Image: Bloomberg, Chart provided by Crypto Finance Analysis Consulting