Bitcoin is lagging behind Ethereum during this bull-cycle. The first cryptocurrency by market cap has been outperformed in the higher timeframes with an 18.2% profit and 2.1% loss in the weekly and monthly chart respectively. In the meantime, ETH pushed into price discovery with seemingly unstoppable momentum.
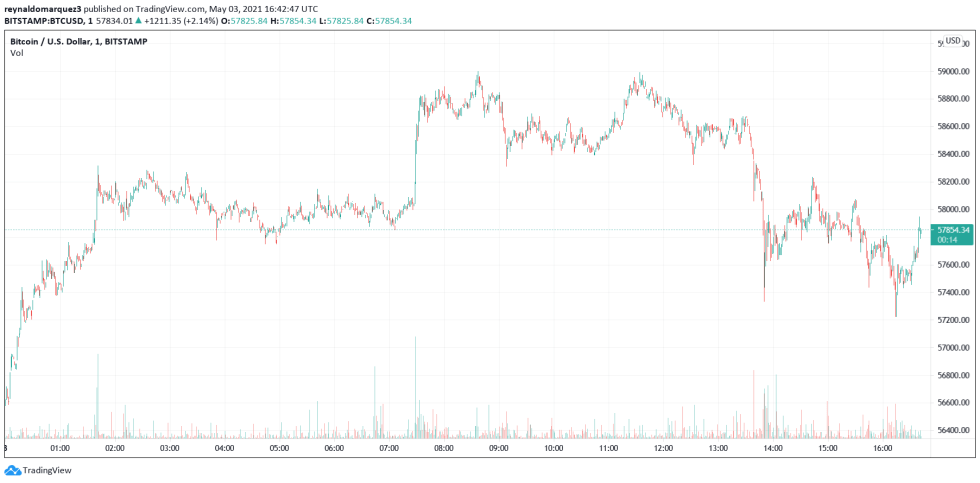
BTC trades at $57,723 moving sideways in the 1-hour chart and daily chart, at the time of writing. However, the cryptocurrency could benefit from the attention set at Ethereum. During April, the BTC market was over leverage with many investors betting at short-term appreciation due to Coinbase’s debut in the public market.

When the cryptocurrency failed to meet the expectations, massive liquidations follow. Over $10 billion in liquidations were registered at that time and BTC’s price crashed all the way back to the critical support zone at $47,000.
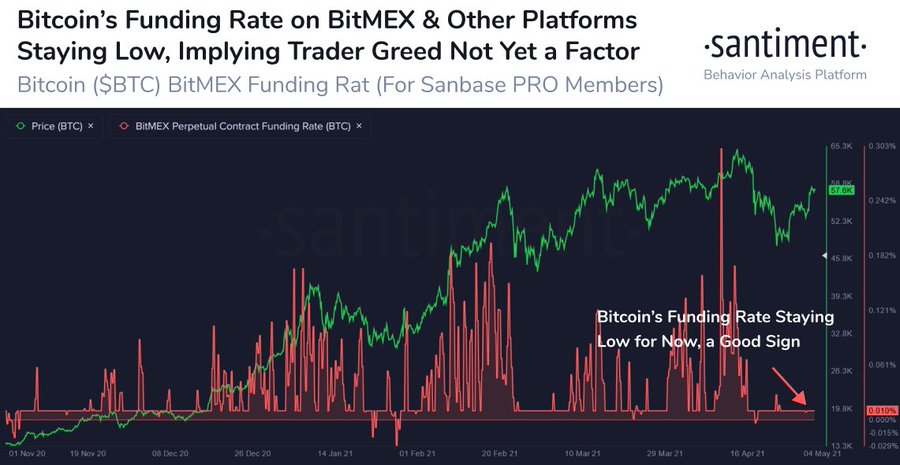
Data from Santiment shows that the market has de-leverage and while Bitcoin’s price recovers it seems more likely to stay at its current levels. As the research firm stated, the attention has flip towards Ethereum and, in consequence, BTC’s funding rate across exchange platforms remains low, but with an upward trend. Santiment shared the chart below and stated the following:
With the crypto crowd’s eyes increasingly on #Ethereum these past couple weeks, Bitcoin’s funding rate on BitMEX & others have stayed low. This means that leveraged longs & euphoric behavior are dormant, and $BTC is a better bet than usual to rise.

Further data provided by Santiment indicates that the Crow FUD and Disbelief Return, a metric used to measure investors’ sentiment, points to a generally negative perception of Bitcoin’s price performance. This disbelief by investors coincides with a $10,000 price rally during the weekend and has been “ironically fueling prices higher”, according to the research firm.

Bitcoin Holders Have A Strong Grip On Their Coins
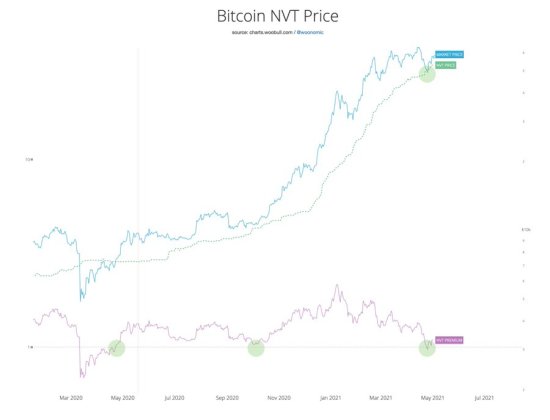
Analyst Willy Woo observed Bitcoin Network Value To Transactions Ratio (NVT Ratio), a metric that values investor activity as a percentage relative to supply, and claims the cryptocurrency has entered into “levels of undervaluation”.
These levels were last registered in April and October 2020, when BTC’s price stood at $7,500 and $10,500, respectively. As the chart below shows, in both these periods, BTC went into massive rallies soon after that. When asked about the effect of Ethereum’s rally on BTC’s price, Woo said:
(…) ETH and alt-season has been dragging capital out of BTC while it’s sideways. Once BTC breaks ATH with a clean run, that capital flows back in.

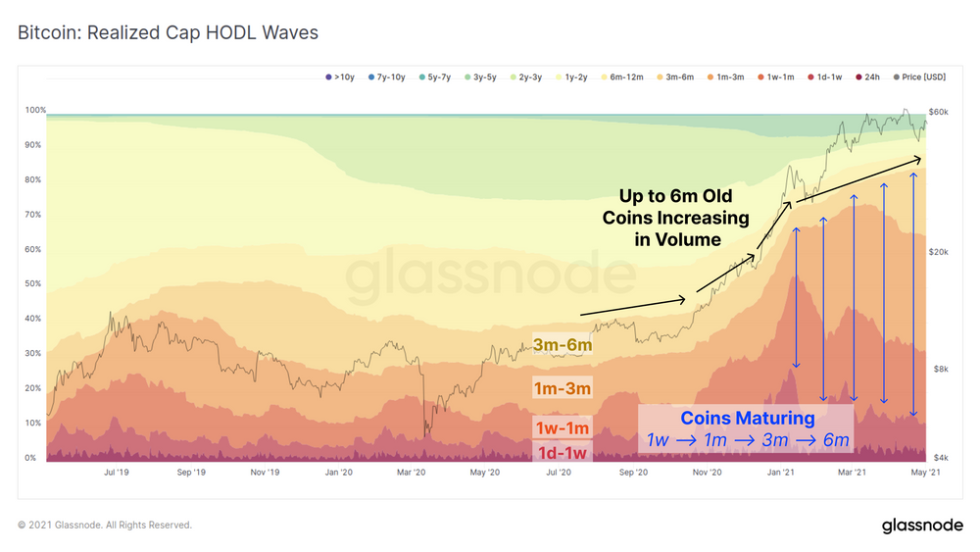
Additional on-chain data from Glassnode suggests high levels of conviction from BTC’s holders. The increase in network activity coincides with a rise in the Realised Cap HOLD Waves metric, which measures the number of coins unspent to realize profits. As seen below, the blue arrows reveal an increase in coins accumulated during the start of the bull-market that have remained dormant, according to Glassnode:
Currently the age band for 3m-6m in particular is swelling suggesting many coins are approaching the 155-day Long Term Holder threshold indicating strong conviction to HODL.