

- It’s no secret that Chainlink has been one of the most bullish digital assets throughout 2019 and 2020
- The cryptocurrency recently extended its parabolic momentum when it rallied up to highs of $8.80
- Although it is possible that a combination of hype and investor “FOMO” could help drive LINK higher, there are some reasons why analysts are growing cautious
- One trader pointed to the emergence of a large rising wedge pattern as one factor that could cause it to decline
- Another analyst recently explained that from a technical standpoint multiple factors are signaling it overextended itself during the latest rally
- The confluence of all these factors suggests a pullback is imminent
Chainlink’s impressive macro uptrend over the past couple of years is showing few signs of slowing, as it was just recently able to incur some explosive momentum that sent it rallying past its previous highs.
The cryptocurrency is now flashing some signs of being overextended, as it has formed a rising wedge pattern that seems to indicate further downside could be imminent.
These patterns tend to end in decisive downwards movements.
This isn’t the only technical factor currently working against Chainlink’s favor, as the cryptocurrency has also flashed three other warning signs that analysts are closely watching.
Chainlink Flashes Signs of Weakness as It Struggles to Surmount Near-Term Resistance
At the time of writing, Chainlink is trading up marginally at its current price of $8.45. This is around where it has been consolidating throughout the past week.
It is important to note that the cryptocurrency is trading just a hair below its recently established all-time highs of $8.80.
This recent price action, and the multiple rejections it has posted at these highs, has caused the cryptocurrency to form a large rising wedge pattern.
One analyst spoke about this in a recent tweet, offering a chart showing that this pattern has been formed in tandem with declining trading volume.
“Rising wedge in a bullish market. Bear trap or the end of the marine party? Stay tuned,” he said.
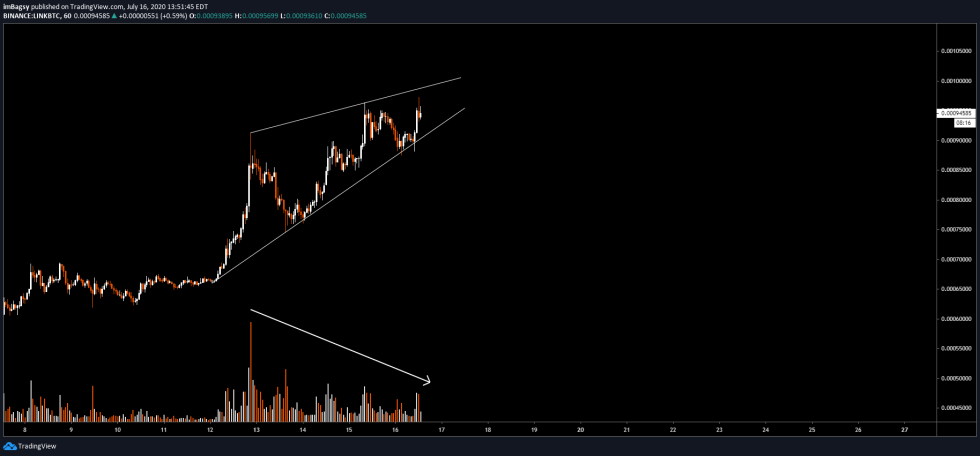

Image Courtesy of Bagsy. Chart via TradingView.
These Three Factors Are Currently Working Against LINK’s Favor
The rising wedge isn’t the only thing currently signaling downside could be inbound for Chainlink.
Another analyst pointed to three concerning factors showing that its uptrend may have overextended itself.
“I dont wanna be THAT GUY but LINK might be overbought here… 1. RSI ATH 2. Near R5 Yearly Pivot Res 3. PF Extension Diag Res… Next signals to watch for: 1. Bearish Reversal Pattern 2. Bear Div… There is an RSI bear div on the 12h already… 55k-60k sats would be my re-buy,” he said.
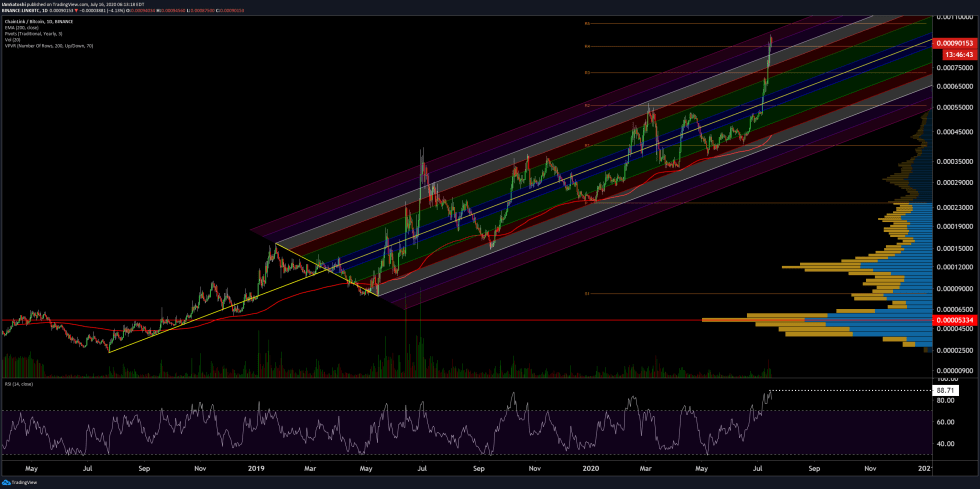

Image Courtesy of Josh Olszewicz. Chart via TradingView.
Because Chainlink has rallied independent from the rest of the market, it is probable that it can also enter its own, isolated, downtrend as well.
Featured image from Shutterstock.
Charts and pricing data from TradingView.