

- “Explosive” would be a good term to describe Ethereum’s price action over the past week. Per data from TradingView, the asset is up approximately 35% in the past seven days when assuming the $230 highs the asset surged to.
- Analysts say this rally is a byproduct of the strong fundamental trends that the underlying Ethereum blockchain is seeing.
- These trends include ETH2 moving closer, adoption of decentralized finance, and Ethereum finding use as tools for prominent companies like Reddit and Ernst and Young.
- Three on-chain and social signs, though, indicate the asset could soon face a correction.
Ethereum Could Face a Correction, Predicts Blockchain Data Firm
According to blockchain analytics firm Santiment, there are four signs that Ethereum’s ongoing rally may soon halt. The company shared this list of trends on Twitter on July 28th. They are as follows:
- Mentions of “Ethereum” on social media have spiked to highs not seen since July of 2019. This may be seen as bullish but the company notes that “social volume spikes historically coincide with tops.” This was the case at the February highs and the June 2019 highs.
- This recent social media influx has largely been positive sentiment. Extremely positive social sentiment for Ethereum has indicated the formation of a short-term high on many occasions over the past year.
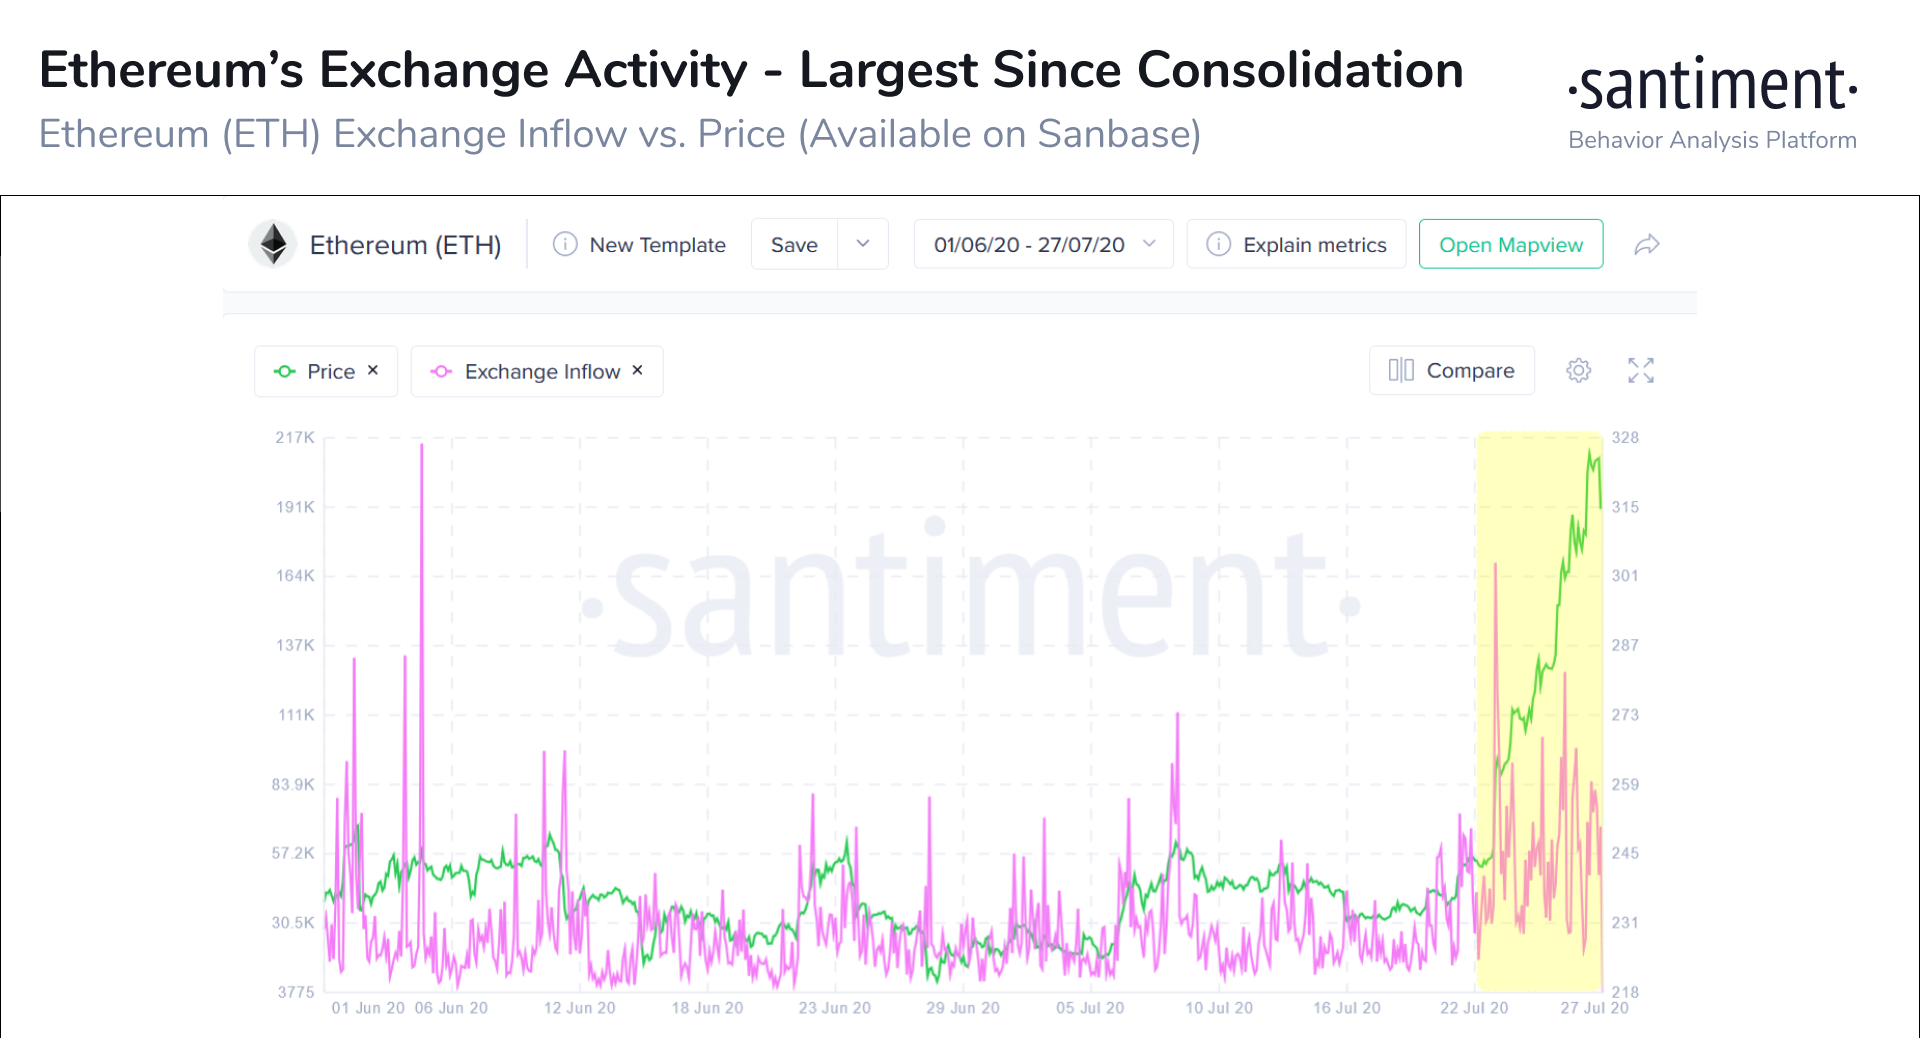
- Crypto exchanges just experienced the biggest inflow of ETH since the price spike in early June. This isn’t necessarily bearish unless you assume these coins will soon be sold for fiat or altcoins.

This latest analysis by Santiment comes shortly after the company pointed to another metric suggesting ETH could pull back.
The company wrote just days ago:
“With $ETH peaking at $316 yesterday, the @santimentfeed DAA vs. Price YTD model shows that the surplus of daily active addresses transacting has finally been equalized by its price. For the first time since June 17th, there is now a deficit of DAA, which indicates the potential of a short-term pullback.”
Technicals Agree
The technicals purportedly agree with the bearish outlook that the on-chain indicators and social trends paint.
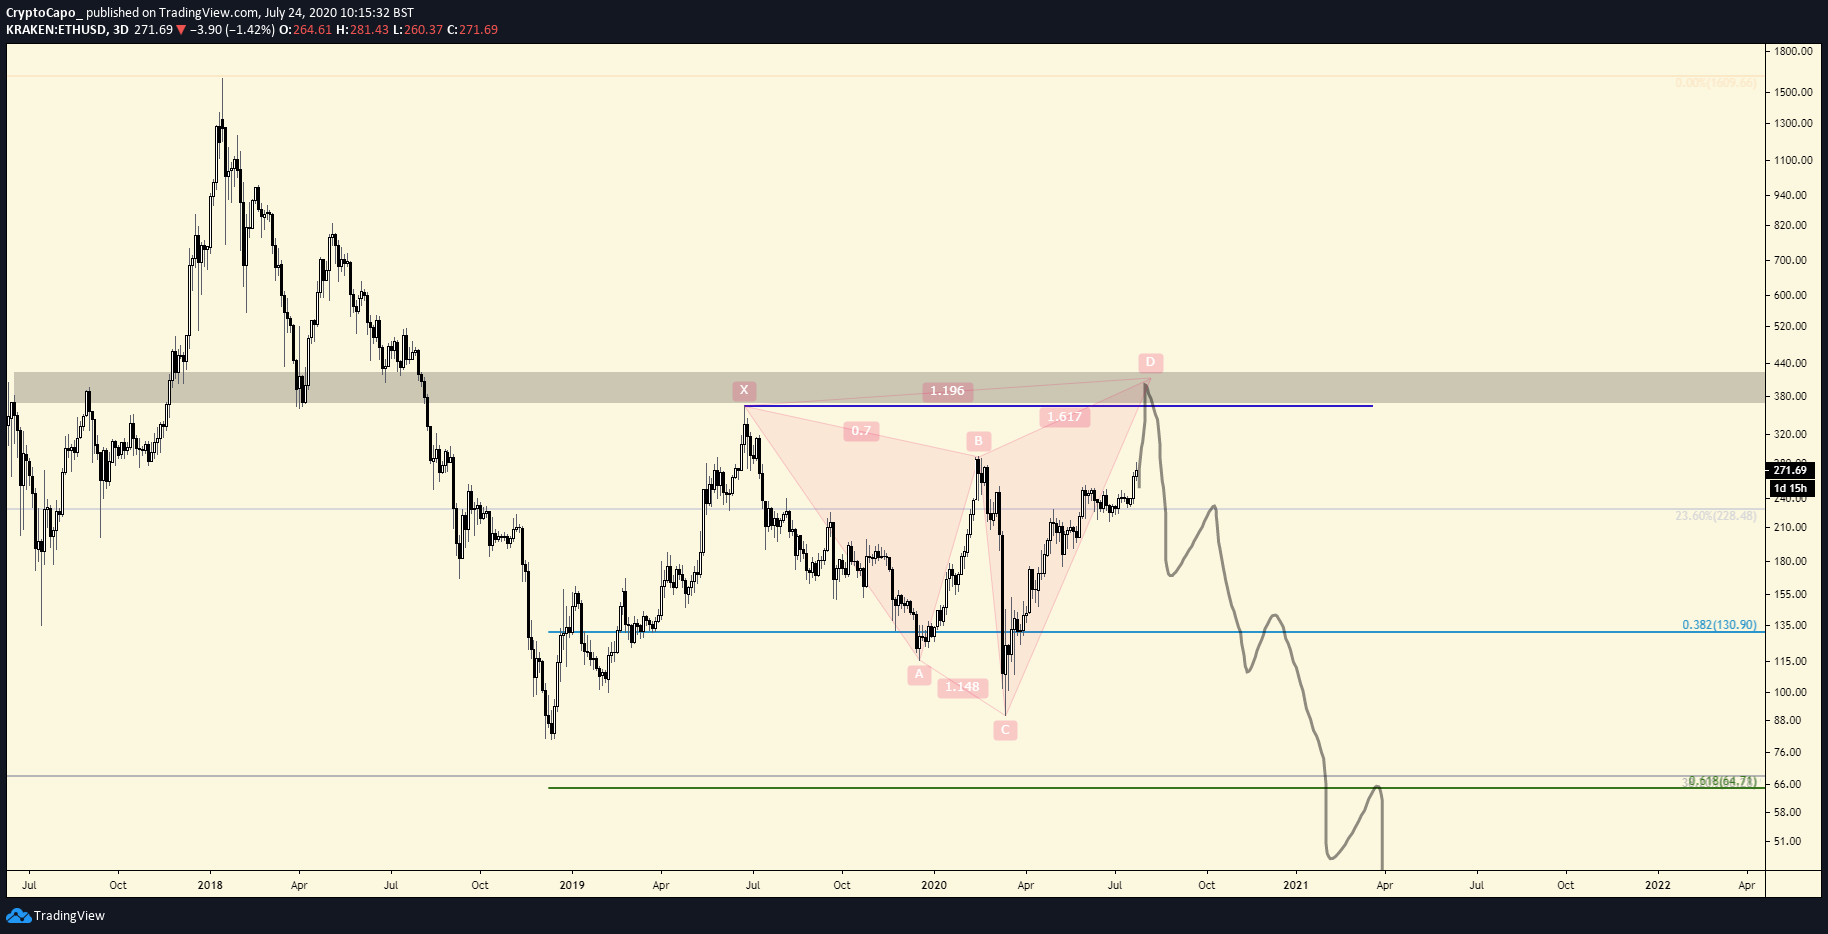
As reported by Bitcoinist previously, one trader shared the chart below, writing that Ethereum is trading in a bearish harmonic pattern that will result in it topping at $380. What the analyst expects to follow this top is a drop under $100 early in 2021.

Another analyst shared a technical indicator suggesting ETH may be overbought. That indicator suggests that Ethereum’s bull trend could soon slow as its technical persistence reaches levels last seen before the March crash.
Featured Image from Shutterstock
Price tags: ethusd, ethbtc
Charts from TradingView.com
These 4 Signs Show Ethereum's 35% Surge Could Soon Be "Halted"