

- Bitcoin has further extended its long-held bout of sideways trading as it hovers within the lower-$9,000 region
- It is continuing to flash some signs of weakness, however, as its price has been unable to garner any upwards momentum
- This weakness has caused the one indicator to suggest that the crypto could be positioned to see a swift movement to lows of $7,100 if it is unable to garner any heavy buying pressure
- This comes as the crypto’s sellers begin flipping a previous support level into resistance, signaling that further short-term weakness is imminent
Bitcoin’s lackluster price action isn’t letting up, as the cryptocurrency is currently caught within a bout of trading between $9,000 and $10,000.
This range has been established over the past couple of months, and each break above or below it has been fleeting.
It is a strong possibility that this consolidation phase is BTC’s way of “coiling up” before it makes a massive movement.
One technical indicator seems to suggest that this next movement could heavily favor bears, as the Ichimoku Cloud shows that a breakdown could lead the crypto to $7,100.
That being said, the same indicator also suggests that a breakout could catalyze some significant momentum that sends it to $13,000.
Bitcoin Flashes Signs of Short-Term Weakness as Previous Support Becomes Resistance
At the time of writing, Bitcoin is trading down just over 1% at its current price of $9,080. This is around where it has been trading over the past couple of days.
Last week, BTC incurred some turbulence when its price ran to highs of $9,800 before facing a rejection that sent it down to lows of $8,900.
Although this jeopardized the crypto’s consolidation phase, buyers had enough strength to send it back above the lower boundary of its established range.
One factor to be aware of is a recent support-resistance flip of $9,225 that could fuel further downside.
An analyst spoke about this level in a recent tweet, explaining that “bulls want to be above it.”
“Daily price action. Previous support now resistance; bulls want to be above it…” he explained.
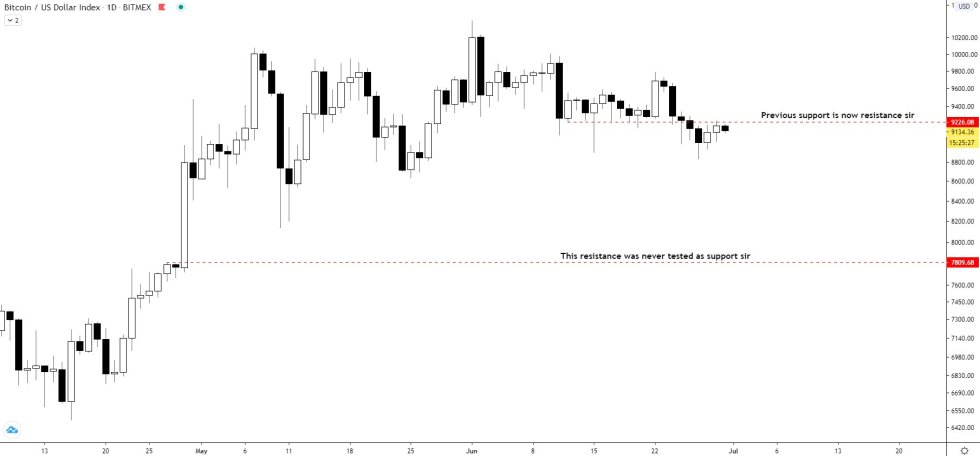

Image Courtesy of Teddy. Chart via TradingView
BTC’s Ichimoku Cloud Shows Price Could Soon Reel To $7,100
Bitcoin’s Ichimoku Cloud is showing that the next movement will likely be massive, with an upside target sitting around $13,000 and a downside target at $7,100.
It is important to note that the consecutive rejections at $10,000, frequent lower highs, and recent support-resistance flip all seem to suggest that this next movement will be downwards.
“1D BTC Cloud still shows weakening bullish momentum…” one popular analyst said while pointing to a chart showing the cloud.
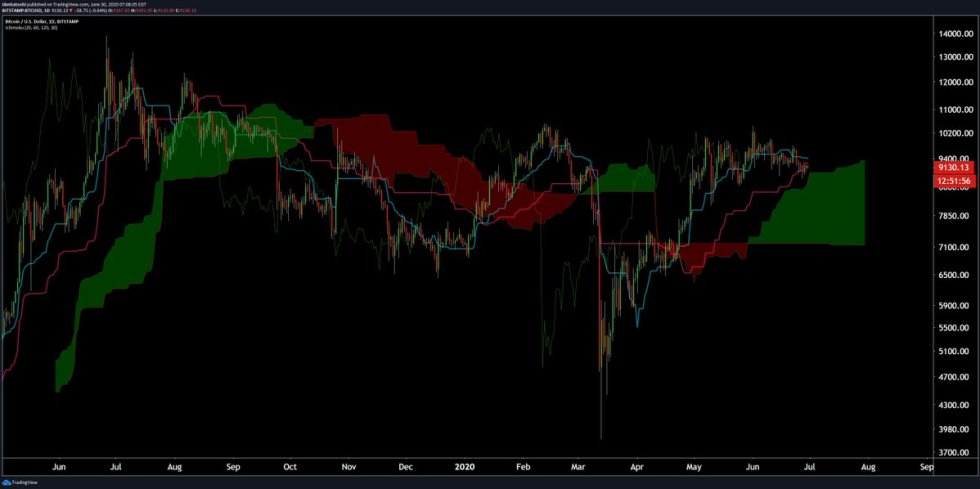

Image Courtesy of Josh Olszewicz. Chart via TradingView

Featured image from Shutterstock.
Charts from TradingView.