

- Bitcoin climbed higher in the last 24 hours, breaking above the $9,500-mark for the first time in a month.
- The jump helped improve the cryptocurrency’s short-term bullish sentiment after weeks of a sideways trend.
- Nevertheless, a convincing fractal from 2019 shows that the upside enthusiasm may live shorter than expected.
This week saw Bitcoin breaking out of its narrow trading range to leap over $9,500, a level it last touched on June 23.
The benchmark cryptocurrency staged an impressive upside run as investors grappled with lower bond yields and a declining US dollar. On Wednesday, BTC/USD established a fresh third-quarter high at circa $9,567. Upon entering the current trading session, the pair was maintaining support above $9,500.

The same sentiment helped other indexes and assets surge. While on one hand, the S&P 500 index jumped into positive territory year-to-date, up 1.4 percent, safe-haven gold glittered after topping above $1,800 an ounce.
Bitcoin Technicals Turn Bullish
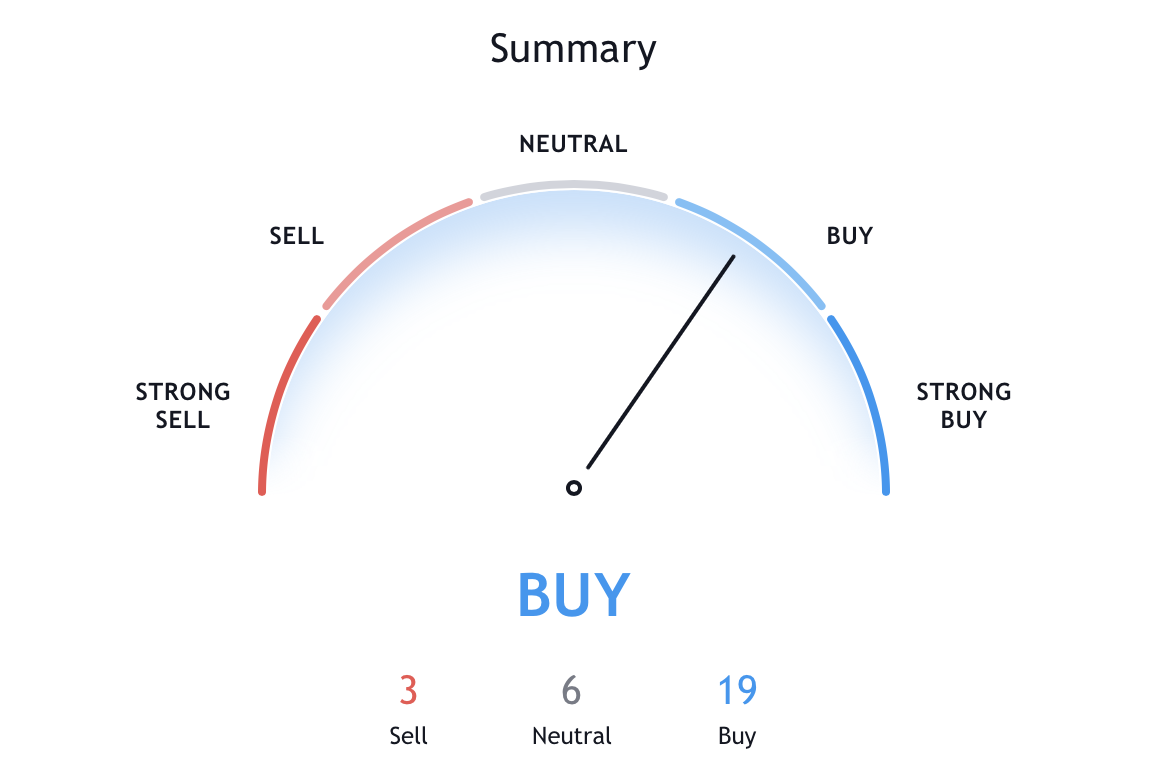
BTC/USD’s upside move flipped a majority of its technical indicators to ‘bullish.’ According to data provided by TradingView.com, the pair is now trending above 99 percent of all its key moving averages. Meanwhile, three out of eleven leading fractal-based indicators are flashing a buy signal. Five remains neutral.
Ronnie Moas, the founder of Standpoint Research – a crypto-focused investment firm, said that he sees Bitcoin continuing its price rally in the coming session. He cited examples of big shares like that of Amazon and Tesla that were once trending lower but logged explosive growth-oriented bull runs.
“My target for BTC is $28,000 for 2021 [and above] $50,000 for 2024,” wrote Mr. Moas.
But an old bearish fractal may spoil the bullish plans in the coming sessions.
Crash FUD
Bitcoin’s latest jump above $9,500 eerily comes as its price consolidates amid two converging trendlines. Meanwhile, the consolidation itself follows a parabolic upside rally that took BTC/USD up by almost 175 percent in just three months of trading.
This entire cycle – referred to as ‘Cycle 3’ in the chart below – mirrors Bitcoin’s bull run and subsequent downside correction from 2019 (Cycle 1).
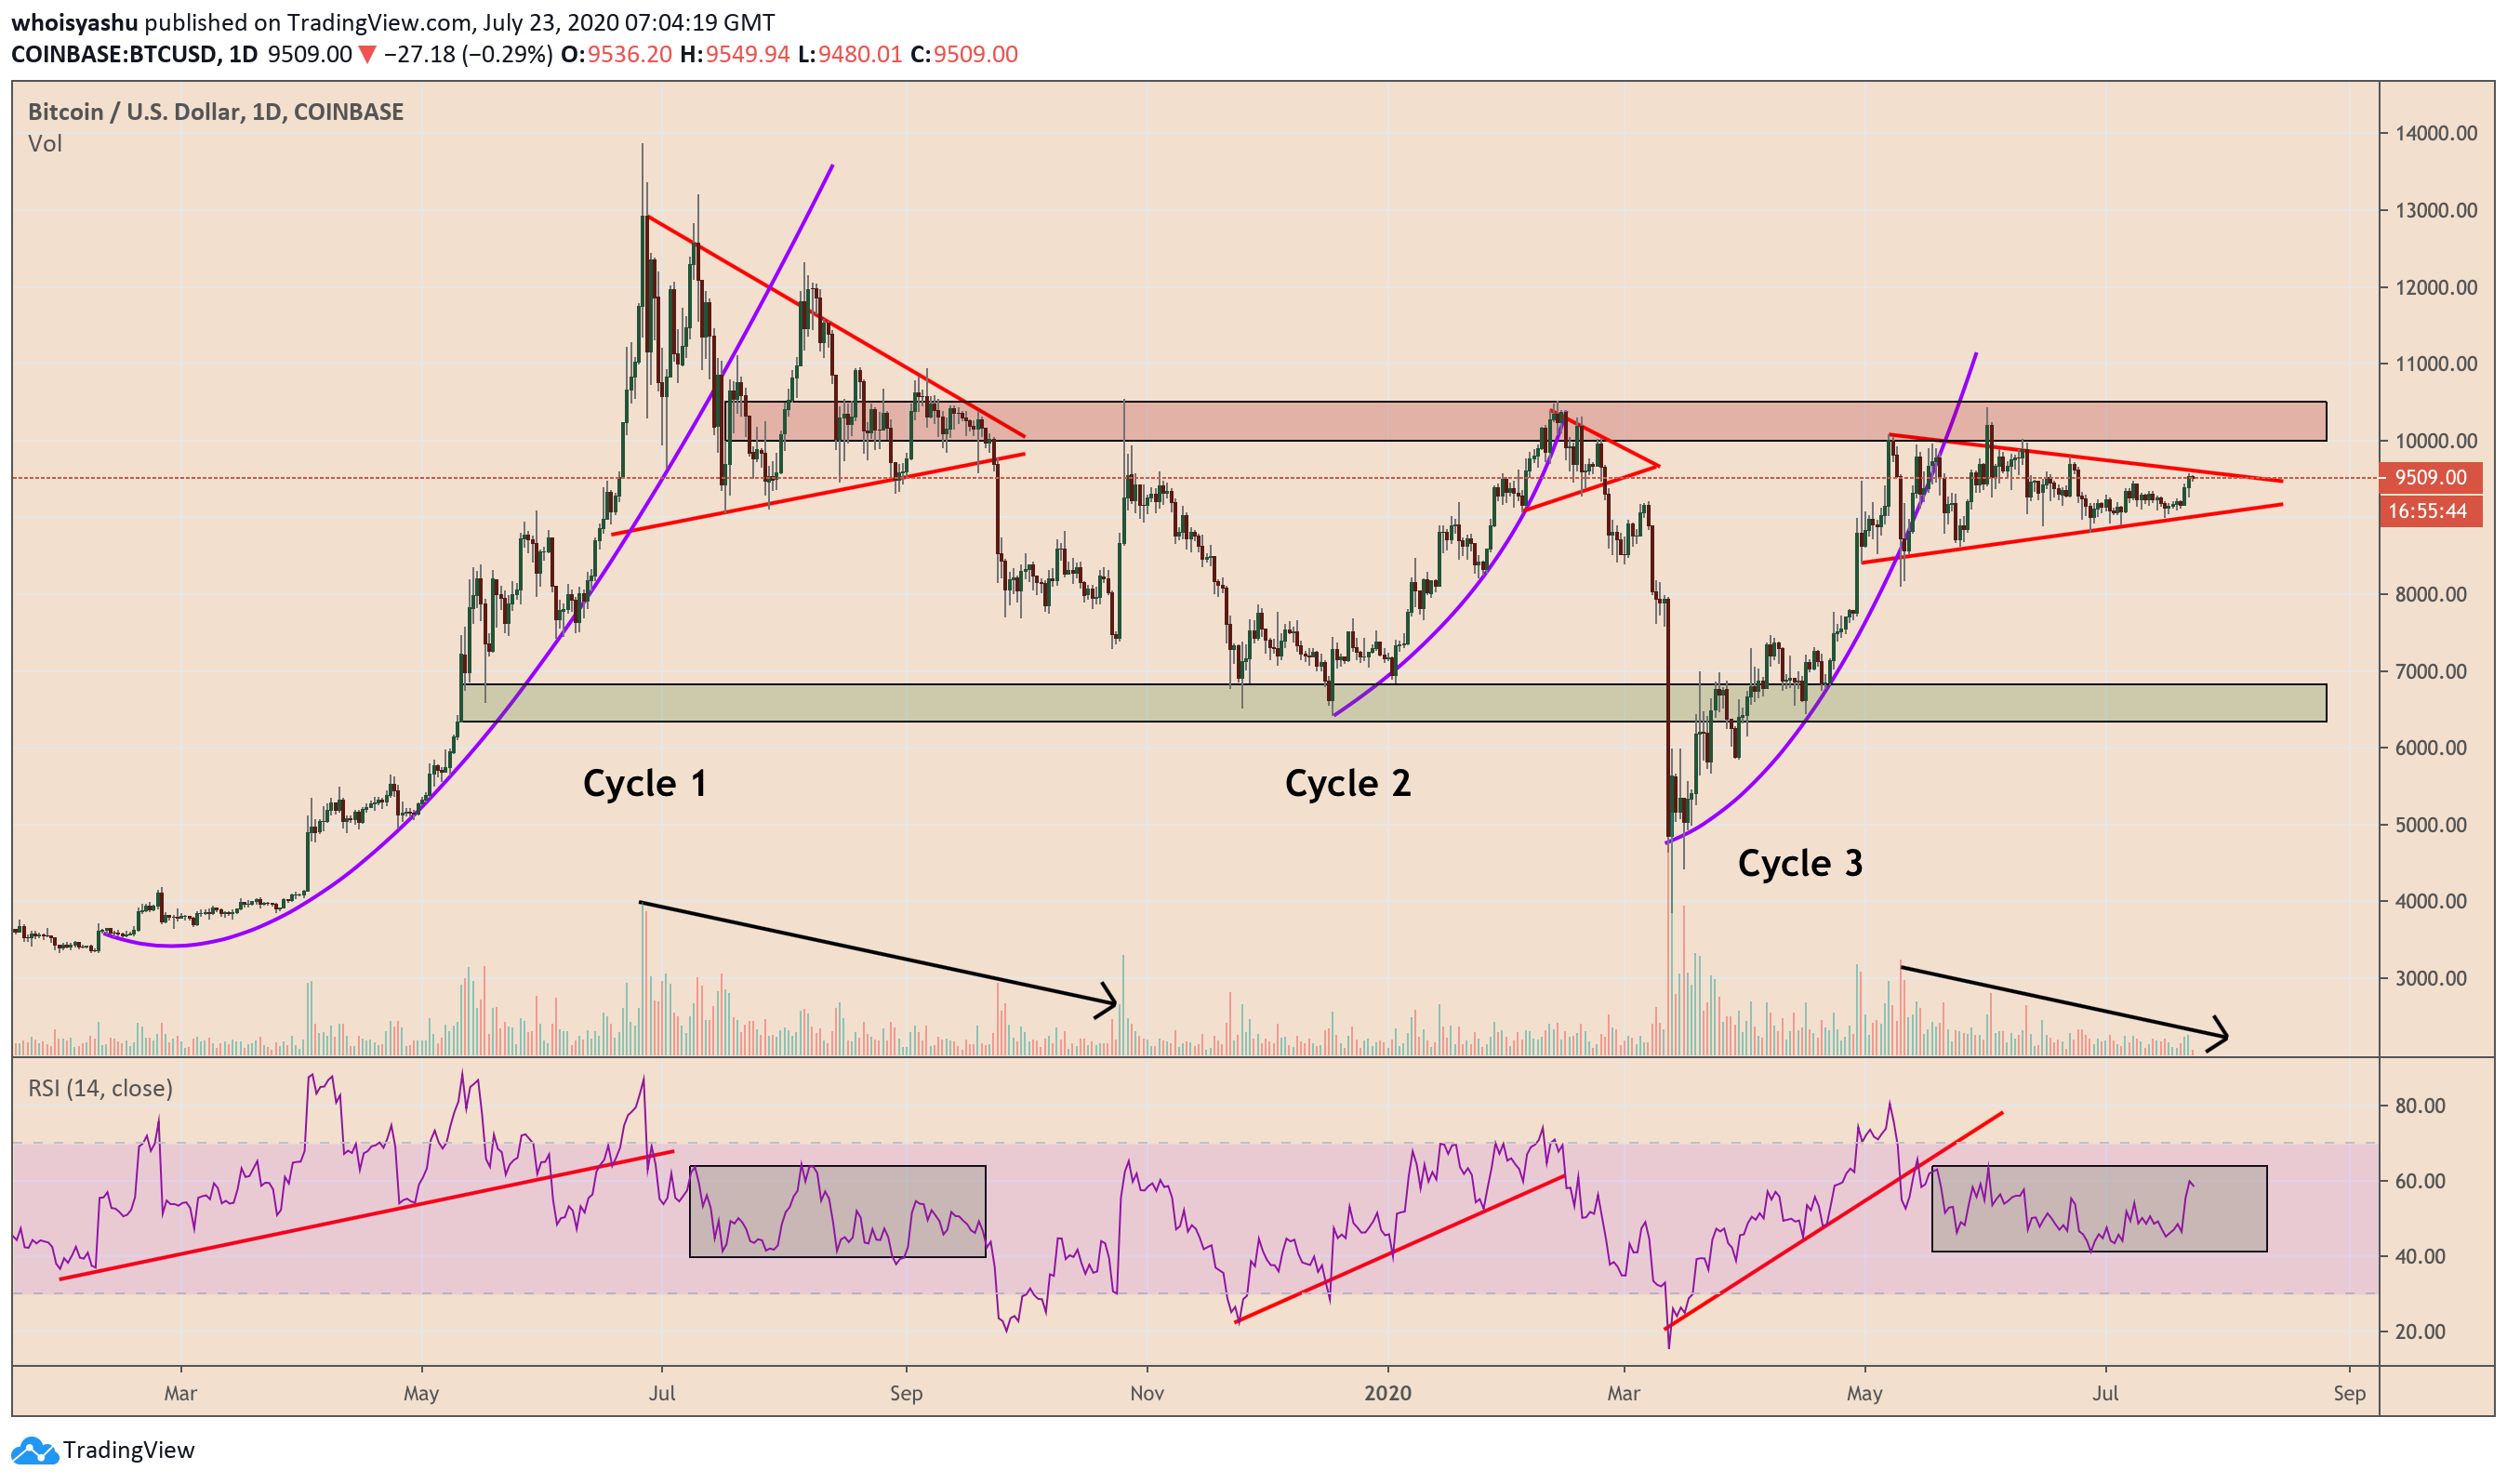
The ‘Cycle 1’ shows Bitcoin trending higher by more than 270 percent within months. As it forms a top near $14,000, traders start securing their profits by selling their holdings at high. It leads to a downside correction until bulls locate a support range (the red area).
BTC/USD later juggles inside a Triangle-like pattern, leaving behind a string of lower highs and lower lows. Bulls finally give up protecting the support range, causing a breakdown towards the green channel (the $6,000-7,000 range).
Looking at ‘Cycle 3’ gives a similar impression. BTC/USD rose by 175 percent from its mid-March lows. The pair then started trending sideways inside a Triangle-like pattern. The only difference is the “red area,” which is now acting as resistance to BTC/USD’s upside attempts.
The Relative Strength Indicator (RSI), a tool to measure an asset’s buying and selling momentum, is reflecting a neutral scenario. In 2019, it eventually broke to the downside.
Bitcoin would need to close above the red area to invalidate the 2019 fractal. If it does, some analysts see the price going towards or beyond $12,000.