- Bitcoin is pressing higher after consolidating in the mid-$11,000s for a number of days.
- As of the time of this article’s writing, the leading cryptocurrency trades for $11,800.
- BTC is up 2% in the past 24 hours, underperforming Ethereum’s 10% performance.
- A historically accurate analyst expects Bitcoin to press lower towards $11,000 one more time, then potentially break out.
- This is a sentiment differing from other analysts, who argue that Bitcoin is likely to break higher right away.
Bitcoin Could Drop Towards $11,000 Once Again, Says Trader Who Predicted $3,000s
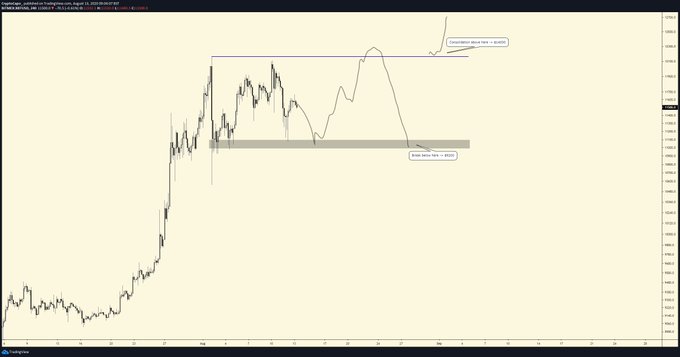
Bitcoin is likely to move towards $11,000 by the end of the week, a historically accurate analyst shared on August 13th. The analyst shared the chart below, indicating that he thinks BTC will drop towards $11,000, bounce towards the range highs at $12,000, then return to the $11,000 range lows.
If Bitcoin loses the $11,000 lows on the second test, he expects the cryptocurrency to retrace to $9,200. If it breaks and consolidates above the $12,000 range high, he expects a move to $14,000.
Chart of BTC's price action over the past few weeks by crypto analyst and trader il Capo of Crypto (@Crypto_Capo). Chart from TradingView.com
The trader who shared this chart is the same one who predicted earlier this year that Bitcoin would revisit the $3,000s and XRP would fall to the $0.11 region. He was proven correct when both cryptocurrencies reached his target levels during March’s flash crash.
As an aside, this trader thinks that as long as Bitcoin holds $10,500, altcoins should outperform. He said the following on August 5th:
“11500-11700, then down to test the 10400-10500 support zone, which should hold for a while. Looking for longs above that level and shorts below it. Altcoins should perform very well as long as BTC stays above 10.5k -> $EOS, $XTZ, $XRP, $XLM…”
Breakout First?
While this trader is expecting Bitcoin to enter consolidation, there are many analysts who are expecting an imminent breakout to the upside.
As reported by Bitcoinist previously, one trader who has predicted the point at which Bitcoin would bottom during the drop earlier this week said:
“Lots of liquidity still above us. And the monthly support is still support. Short term I think 11900 is possible. But as you know, mid term I’m still aiming at 13k. Let’s see how much we can get.”

Chart of BTC's recent price action with liquidity chart by trader ByzantineGeneral. Chart from HyBlock.
Adding fuel to Bitcoin’s bull case, on-chain data indicates that few cryptocurrency investors want to sell or use their BTC. The last time this much of the Bitcoin supply was inactive was at the start of 2016’s bull run that took BTC from ~$400 to $20,000.
Featured Image from Shutterstock
Price tags: xbtusd, btcusd, btcusdt
Charts from TradingView.com
Analyst Who Called Bitcoin's Move to $3,000s Thinks This Comes Next


