Data suggests Huobi Token whales and sharks have been accumulating recently despite HT’s 24% decline during the last week.
Huobi Token Whales And Sharks Have Added Almost 18% To Their Holdings In Recent Days
As per data from the analytics platform Santiment, the Huobi Token whales and sharks seem to have been making some movements recently.
The relevant indicator here is the “Supply Distribution,” which tells us what percentage of a crypto’s supply is in what wallet group.
Here, the wallet groups are divided based on the amount of balance in each wallet address. For example, the “1 to 10 coins” group includes all wallets that are holding numbers lying in this range.
In the context of the current discussion, the wallet group of interest is the one corresponding to whales and sharks.
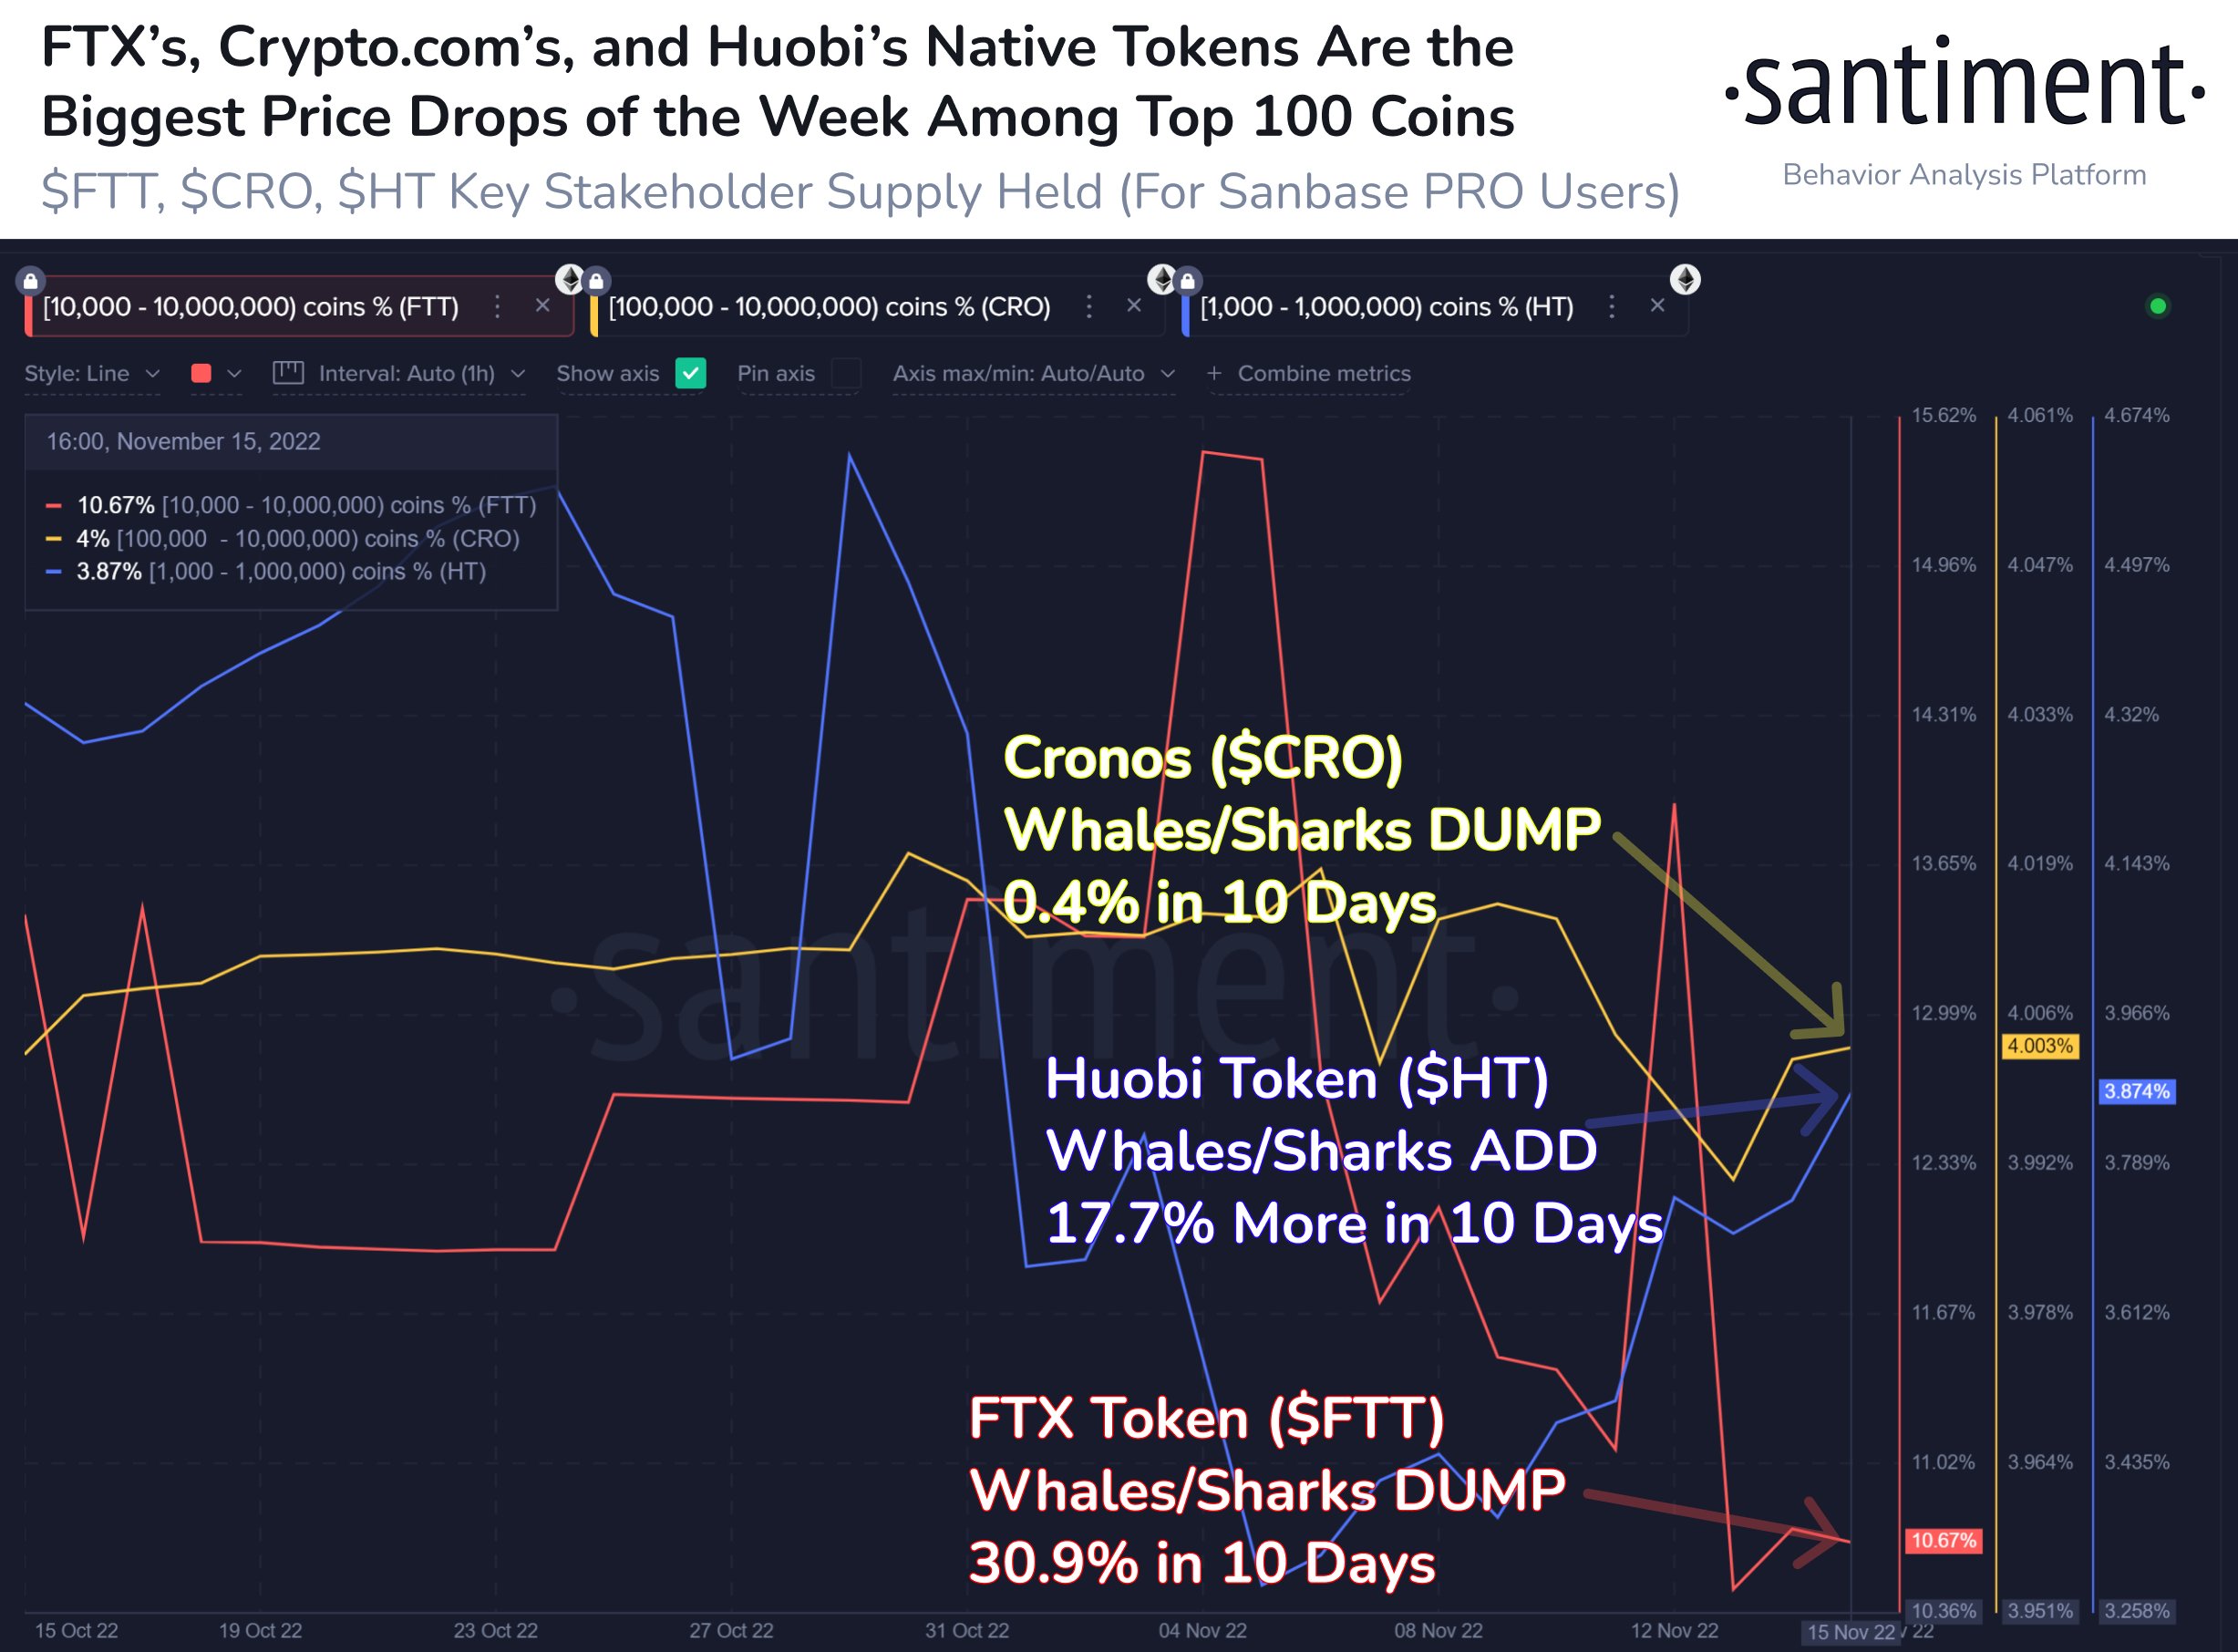
For Huobi Token, this cohort falls into the 1k to 1m coins group. Here is a chart that shows the trend in the Supply Distribution for this band:
The supply distribution data for the whale and shark wallet groups of the three exchange tokens | Source: Santiment
As you can see in the above graph, the percentage of the supply belonging to Huobi Token whales and sharks has gone up by about 17.7% in the last ten days.
This means that these investors have been accumulating the crypto, despite the price falling by 24% in the last week.
The chart also includes the data for this indicator for two other exchange coins: FTX Token (10k to 10m coins) and Cronos (100k to 10m coins).
Given the current market environment, it isn’t a surprise that both these tokens have also observed some heavy downtrend in recent days.
FTT whales and sharks have dumped almost 31% of their holdings since the collapse of the exchange started, while for CRO they have only shed 0.4% of their coins so far.
Large investors buying Huobi Token while the market is more vigilant than ever about exchanges could suggest they have conviction in the coin, and can thus have a bullish impact on HT in the long term.
HT Price
At the time of writing, Huobi Token’s price floats around $4.5858, down 24% in the last week. Over the past month, the crypto has lost 31% in value.
Below is a chart that shows the trend in the price of the coin over the last five days.

Looks like the value of the crypto hasn't shown much movement in the last few days | Source: HTUSD on TradingView
Featured image from Todd Cravens on Unsplash.com, charts from TradingView.com, Santiment.net


