Ethereum is showing notable relative strength as it reclaims the $3,150 level and attempts to push higher, signaling early signs of recovery after weeks dominated by heavy selling pressure, fear, and uncertainty. The broader market rebound has helped restore confidence, but ETH’s ability to outperform key altcoins highlights growing demand and improved sentiment around the asset.
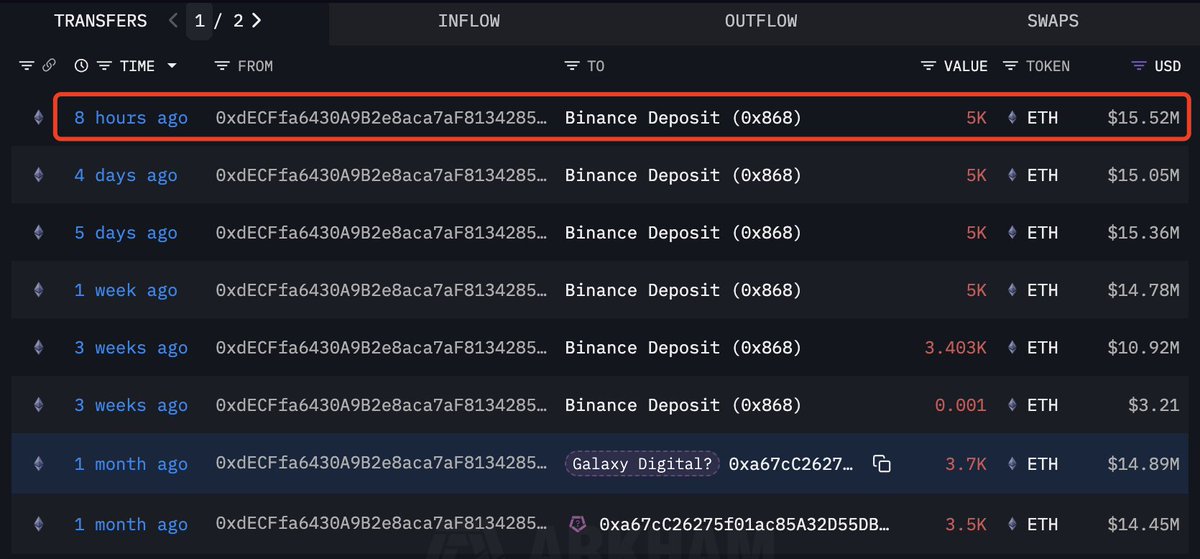
Adding to the renewed optimism, fresh on-chain data from Lookonchain reveals a significant move from one of the market’s most recognized whales. During the rebound, whale 0xdECF deposited another 5,000 ETH—worth approximately $15.52 million—into Binance.
This wallet has become well-known for sending large batches of ETH to exchanges throughout the recent downturn, often coinciding with moments of heightened volatility and capitulation.
Its latest deposit suggests that the whale remains highly active and responsive to market conditions. While such movements can sometimes introduce uncertainty, they also highlight increasing liquidity and engagement from major holders. With price reclaiming key levels and whales repositioning, Ethereum enters a critical phase where sustained strength could confirm a broader shift in market structure.
Ethereum Whale Distribution Highlights Market Caution
According to Lookonchain, whale 0xdECF has sold 25,603 ETH—valued at approximately $85.44 million—across Binance and Galaxy Digital since October 28. Despite this substantial distribution, the wallet still holds 5,000 ETH (around $15.52 million), suggesting that the whale has not fully exited its position but has significantly reduced exposure during the recent market decline.
This pattern of behavior provides important insight into sentiment among large holders: while they are not abandoning Ethereum entirely, they are actively managing risk and responding to volatility more aggressively than usual.
Such persistent selling pressure from a large wallet often acts as a drag on price during periods of weakness, especially when market liquidity is thin. However, the fact that the whale continues to retain a meaningful position indicates an expectation of potential recovery—or at least a desire to remain strategically exposed to future upside.
Ethereum now finds itself in a critical phase. The asset has reclaimed key levels, but its mid-term structure remains highly sensitive to macro conditions and whale behavior. If selling from major holders slows and accumulation begins to outpace distribution, the recent rebound could solidify into a sustained trend. Otherwise, renewed sell flows could place Ethereum at risk of revisiting lower support zones.
ETH Reclaims Short-Term Momentum but Faces Heavy Resistance
Ethereum’s daily chart shows a clear improvement in momentum after reclaiming the $3,150–$3,200 region, but the broader structure remains fragile. The bounce from the $2,750–$2,850 support zone marked a decisive shift in buyer behavior, with strong lower wicks indicating aggressive demand. This rebound has pushed ETH back above key short-term levels, yet the asset still faces a challenging path forward.

Price is now approaching the 50-day SMA, currently sloping downward just above $3,250, which now acts as immediate resistance. This moving average has capped every rally since late October and remains the first major barrier for bulls to reclaim. Beyond it, the 100-day SMA around $3,450 and the 200-day SMA near $3,600 form a tight cluster of overhead resistance that defines the medium-term downtrend.
Volume on the recent bounce is stronger than previous attempts, signaling that buyers are showing more conviction compared to the mid-November attempts to recover. However, the overall trend still leans bearish until ETH can break above the 50-day SMA and begin closing daily candles over $3,300.
Ethereum sits in a critical inflection zone: holding above $3,100 strengthens the case for continued recovery, while rejection from the $3,250–$3,300 band could trigger another retest of the $2,800 region. The next few sessions will determine whether this rebound evolves into a deeper trend reversal.
Featured image from ChatGPT, chart from TradingView.com