

- Bitcoin and the aggregated cryptocurrency market have been leading altcoins higher, with Ethereum showing some immense signs of strength as it once again breaks $470
- The broader crypto market is getting stronger, as altcoins are now rallying in tandem with BTC or closely following it
- If this trend persists, then investor sentiment and risk appetite may continue growing, leading more investors to rotate capital into higher beta assets
- This possibility is already coming to fruition, as all the blue-chip DeFi tokens have been surging throughout the past week
- One analyst is noting that Ethereum may aid in this market-wide uptrend, as one reliable indicator he is watching is flashing some bullish signs
Bitcoin and the aggregated crypto market are pushing higher today, with Ethereum leading altcoins to retest their key resistance levels.
ETH is still underperforming Bitcoin heavily over a macro timeframe, but there is a chance that it will soon fly past $500 and post even further gains if the altcoin market remains strong.
In many ways – at least from a technical perspective – Ethereum is the altcoin market’s backbone.
This could be good for the higher risk tokens, as one analyst is noting that ETH’s high time frame RSI is flashing signs similar to those seen by Bitcoin in 2016 – before it posted a massive bull rally.
Ethereum Rallies as Bitcoin Lifts Market Higher
At the time of writing, Ethereum is trading up just under 2% at its current price of $471.
It still has a way to go before it can shatter the resistance it faces at $500 – which will likely be a strong resistance level.
A break above this level would allow it to gain ground against Bitcoin and likely spark a second wave of altseason.
Analyst Claims ETH’s RSI is Similar to That Seen by Bitcoin in 2016
One trader stated that Ethereum’s high time frame RSI is similar to that seen by Bitcoin in 2016.
This means that it could soon be entering into a parabolic phase that results in exponential gains.
“More than PA i’m focusing my analysis on monthly RSI. Comparing it with 2016 BTC we have a very similar RSI structure. Once more this confirms that $ETH is primed for an imminent breakout.”
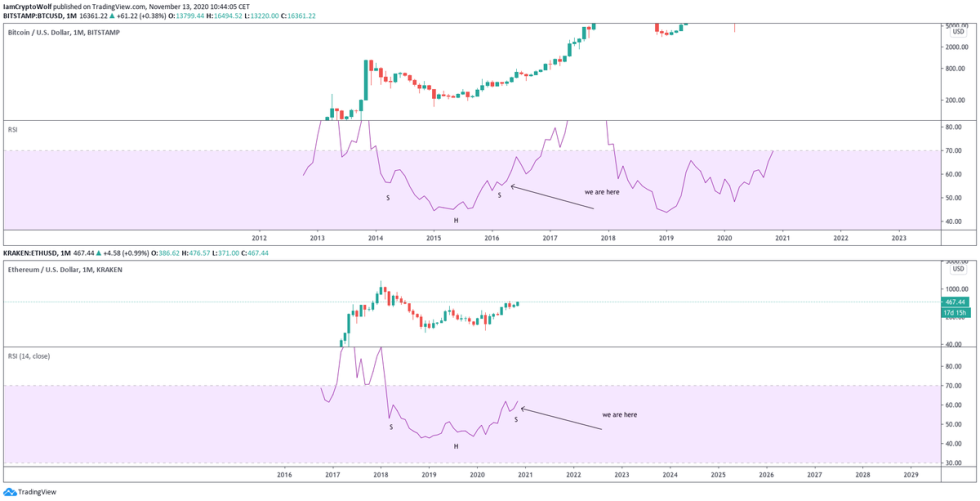

Image Courtesy of Wolf. Source: ETHUSD on TradingView.
If Ethereum’s macro price action unfolds the way it could, based on the above analysis, then this may truly be the early stages of the next market-wide bull run that garners global attention.
Featured image from Unsplash.
Charts from TradingView.