

- Bitcoin’s uptrend has halted after staging a 12 percent bull run earlier this week.
- The cryptocurrency now expects to neutralize its overbought status with either a consolidation or a correction.
- Meanwhile, a set of technical indicators shows a bullish scenario, noting that Bitcoin could continue its rally upwards towards $14,000.
Bitcoin rallied by almost 12 percent earlier this week to establish a year-to-date high at $11,420.
Nevertheless, the benchmark cryptocurrency has since corrected downwards to the tune of as much as 7 percent. Its pullback appeared due to profit-taking sentiment among daytraders.
Also, Bitcoin fell as investors shifted focus back to the stock market after Federal Reserve decided to continue its $2 trillion stimulus program.
On a technical front, the BTC/USD exchange rate appears to have been neutralizing its overbought status. This week’s rally pushed the pair’s daily Relative Strength Index above 70. Such a move typically leads to higher selling pressure, causing an asset to lose value. It, nevertheless, does not reflect the market’s actual bias.
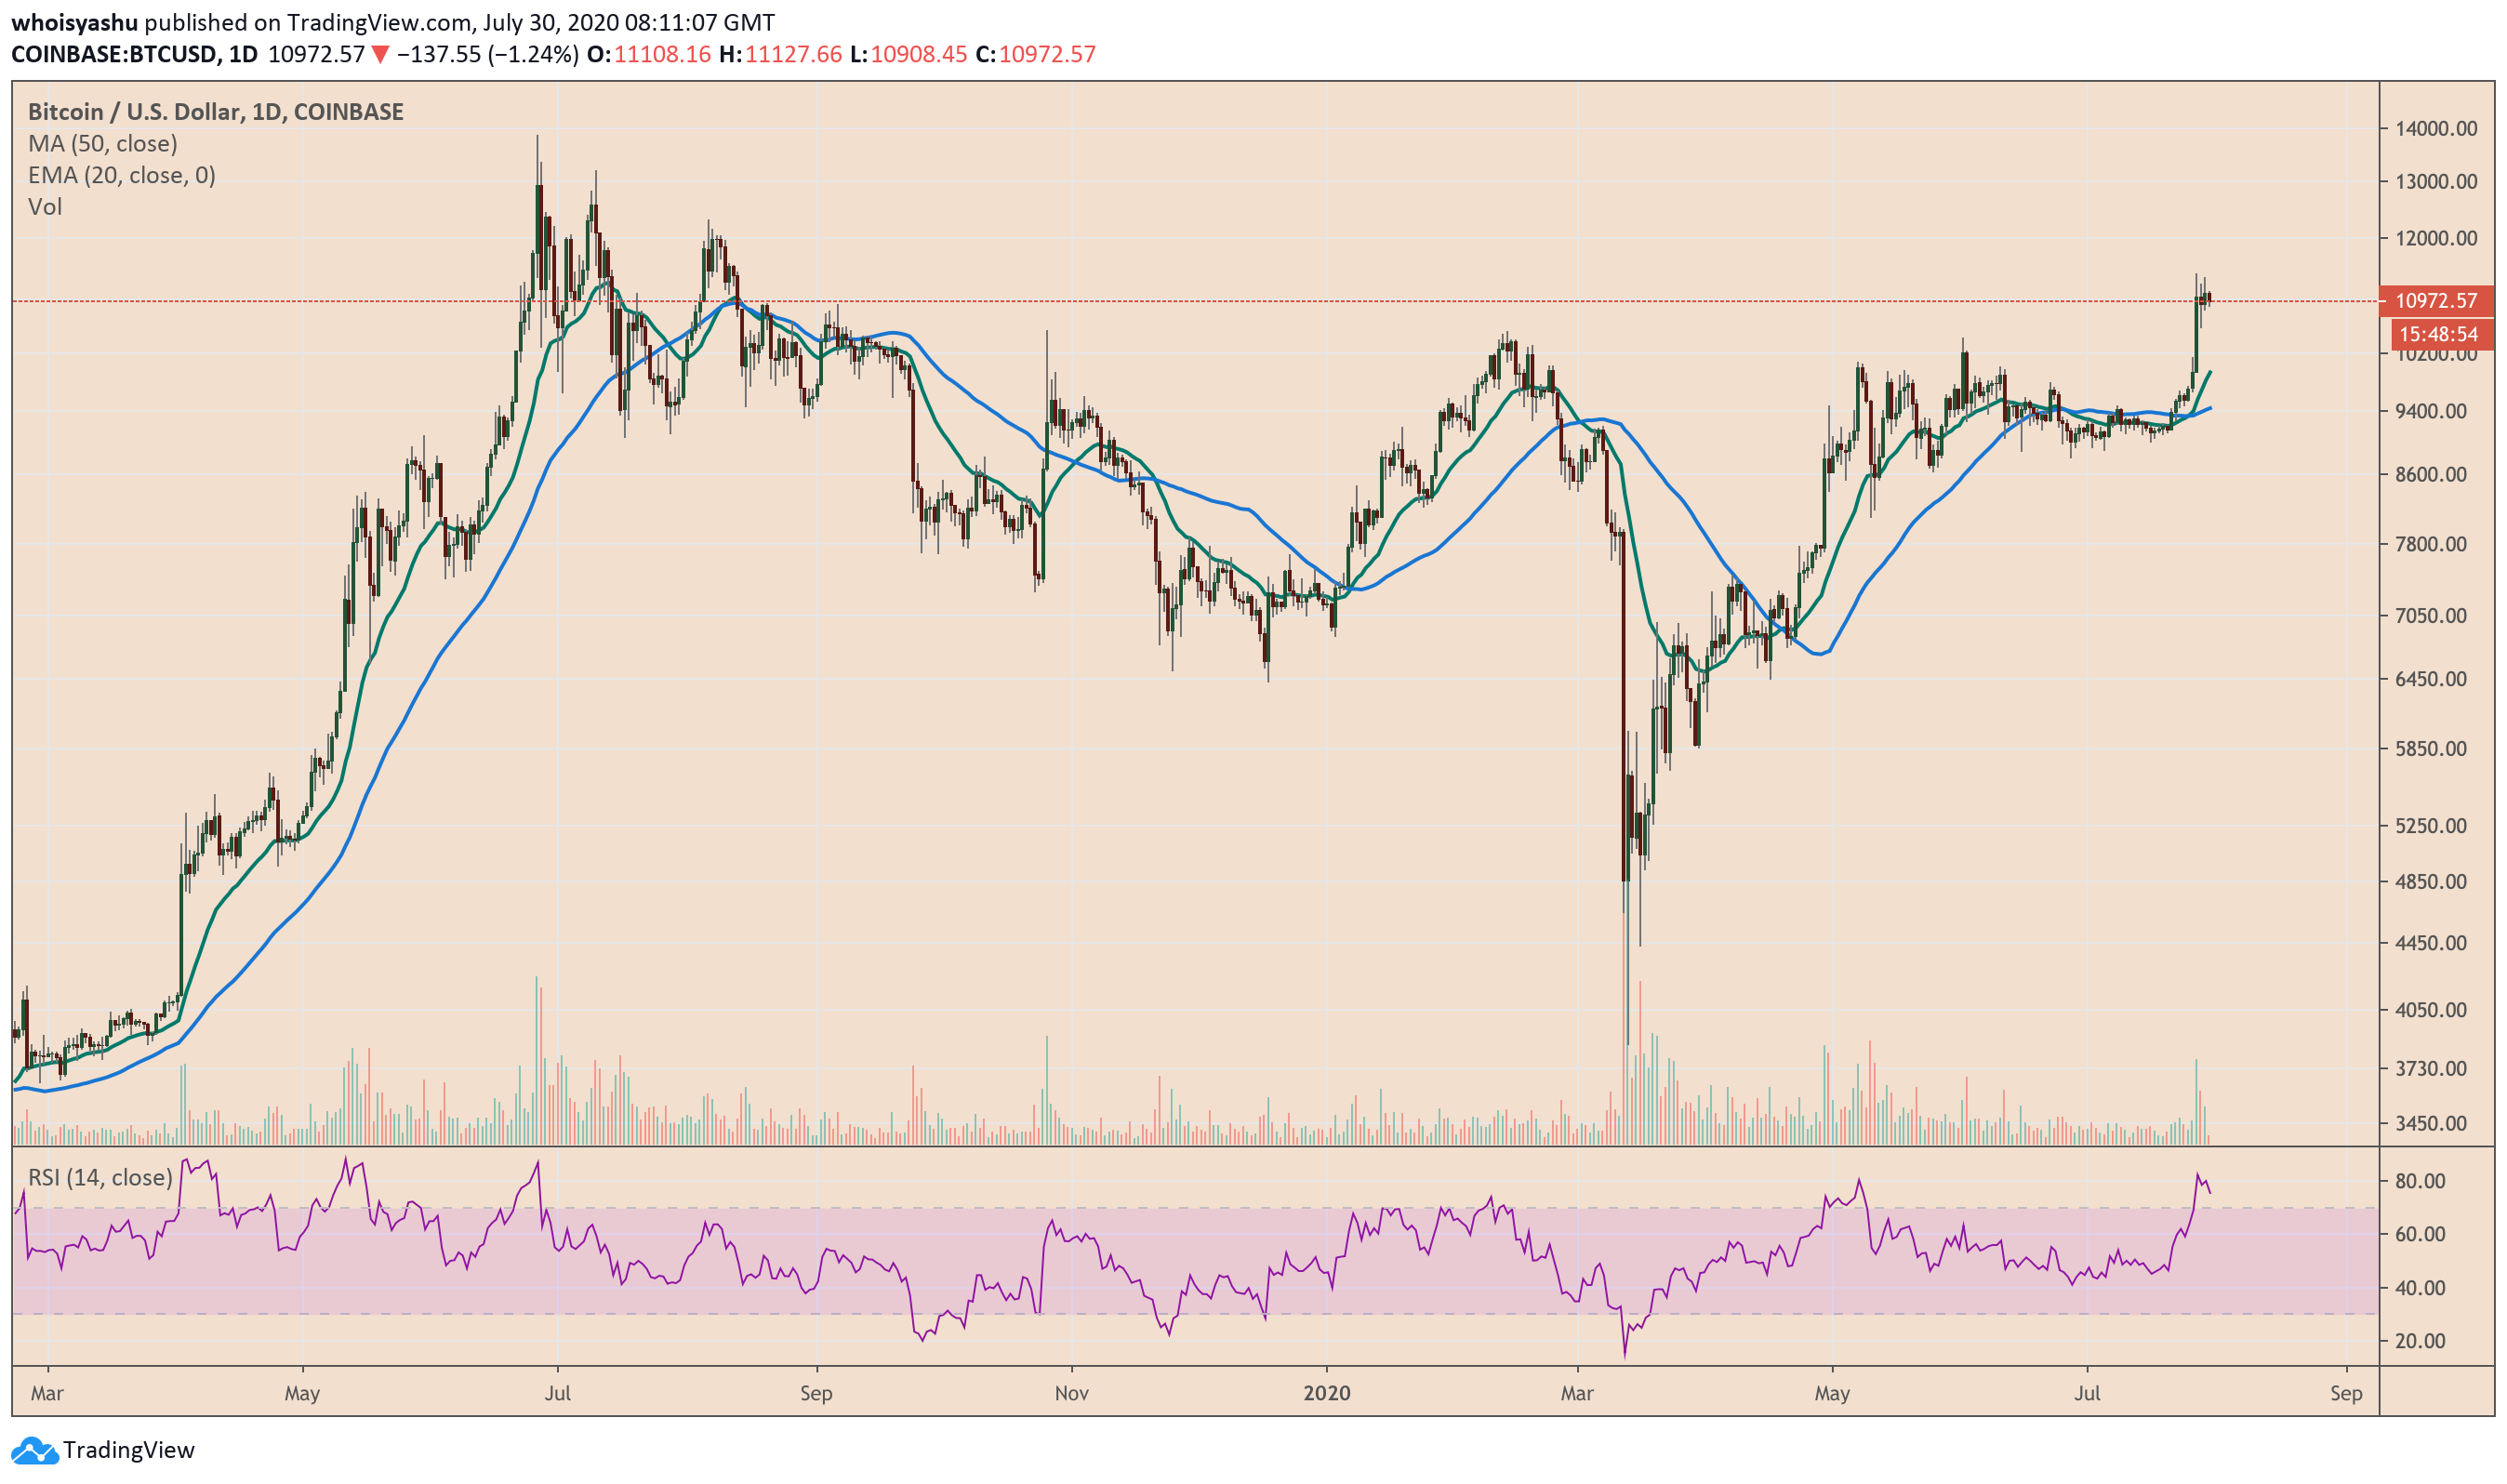
Bitcoin is now left with two potential outcomes when it comes to neutralizing its overbought sentiment. First, the cryptocurrency could consolidate sideways inside a trading range until bulls refuel to continue the prevailing uptrend. Second, it could plunge downwards on further profit-taking sentiment.
Bullish Setup Ahead for Bitcoin
Incidentally, two textbook technical indicators see Bitcoin heading towards at least $12,000 even if it corrects further lower. The first of these patterns, as shown in the chart below, is a now-broken Symmetrical Triangle.
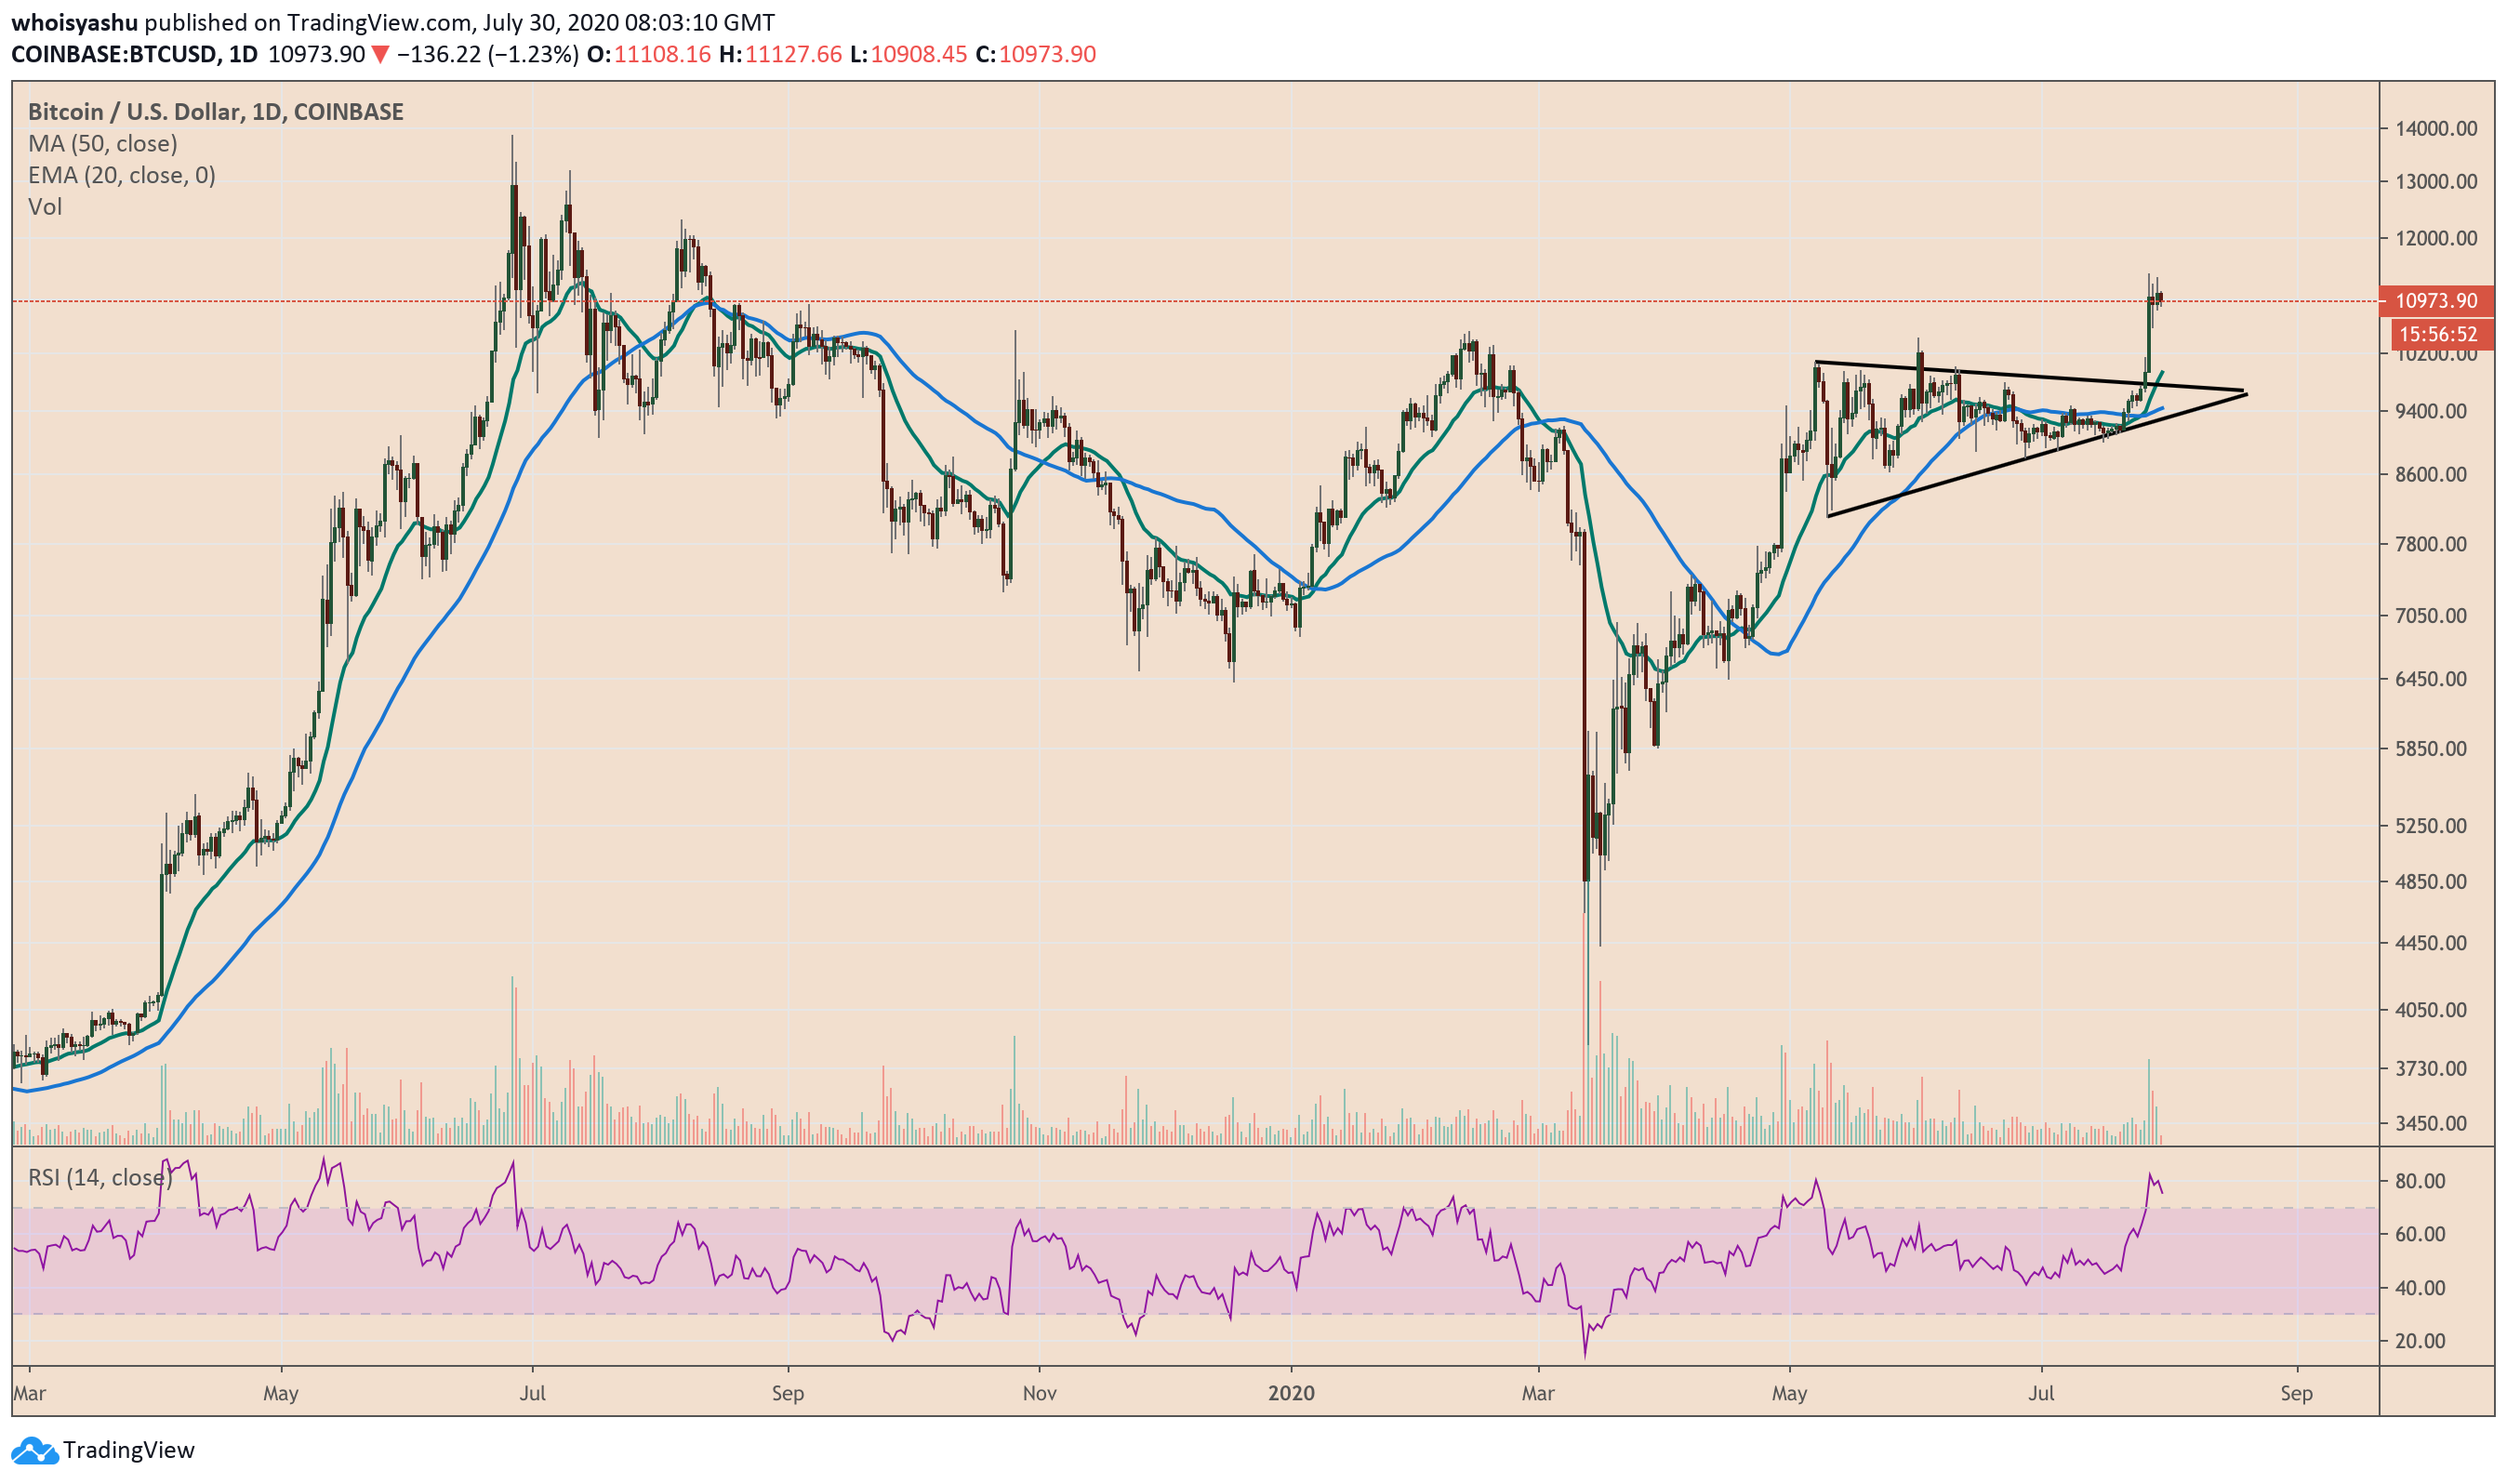
Bitcoin broke out of the Triangle range with a rise in trade volume, fitting the technical description of a breakout move. Ideally, the cryptocurrency should fly by as much as the height of the pattern. The maximum distance between the Triangle’s upper and lower trendline is roughly $1,900.
That places Bitcoin’s Triangle upside target $1,900 above from the point of breakout. It brings Bitcoin within the target range of $12,000.
Another indicator that points to a continued bullish momentum is Moving Average Ribbon (or MMR).
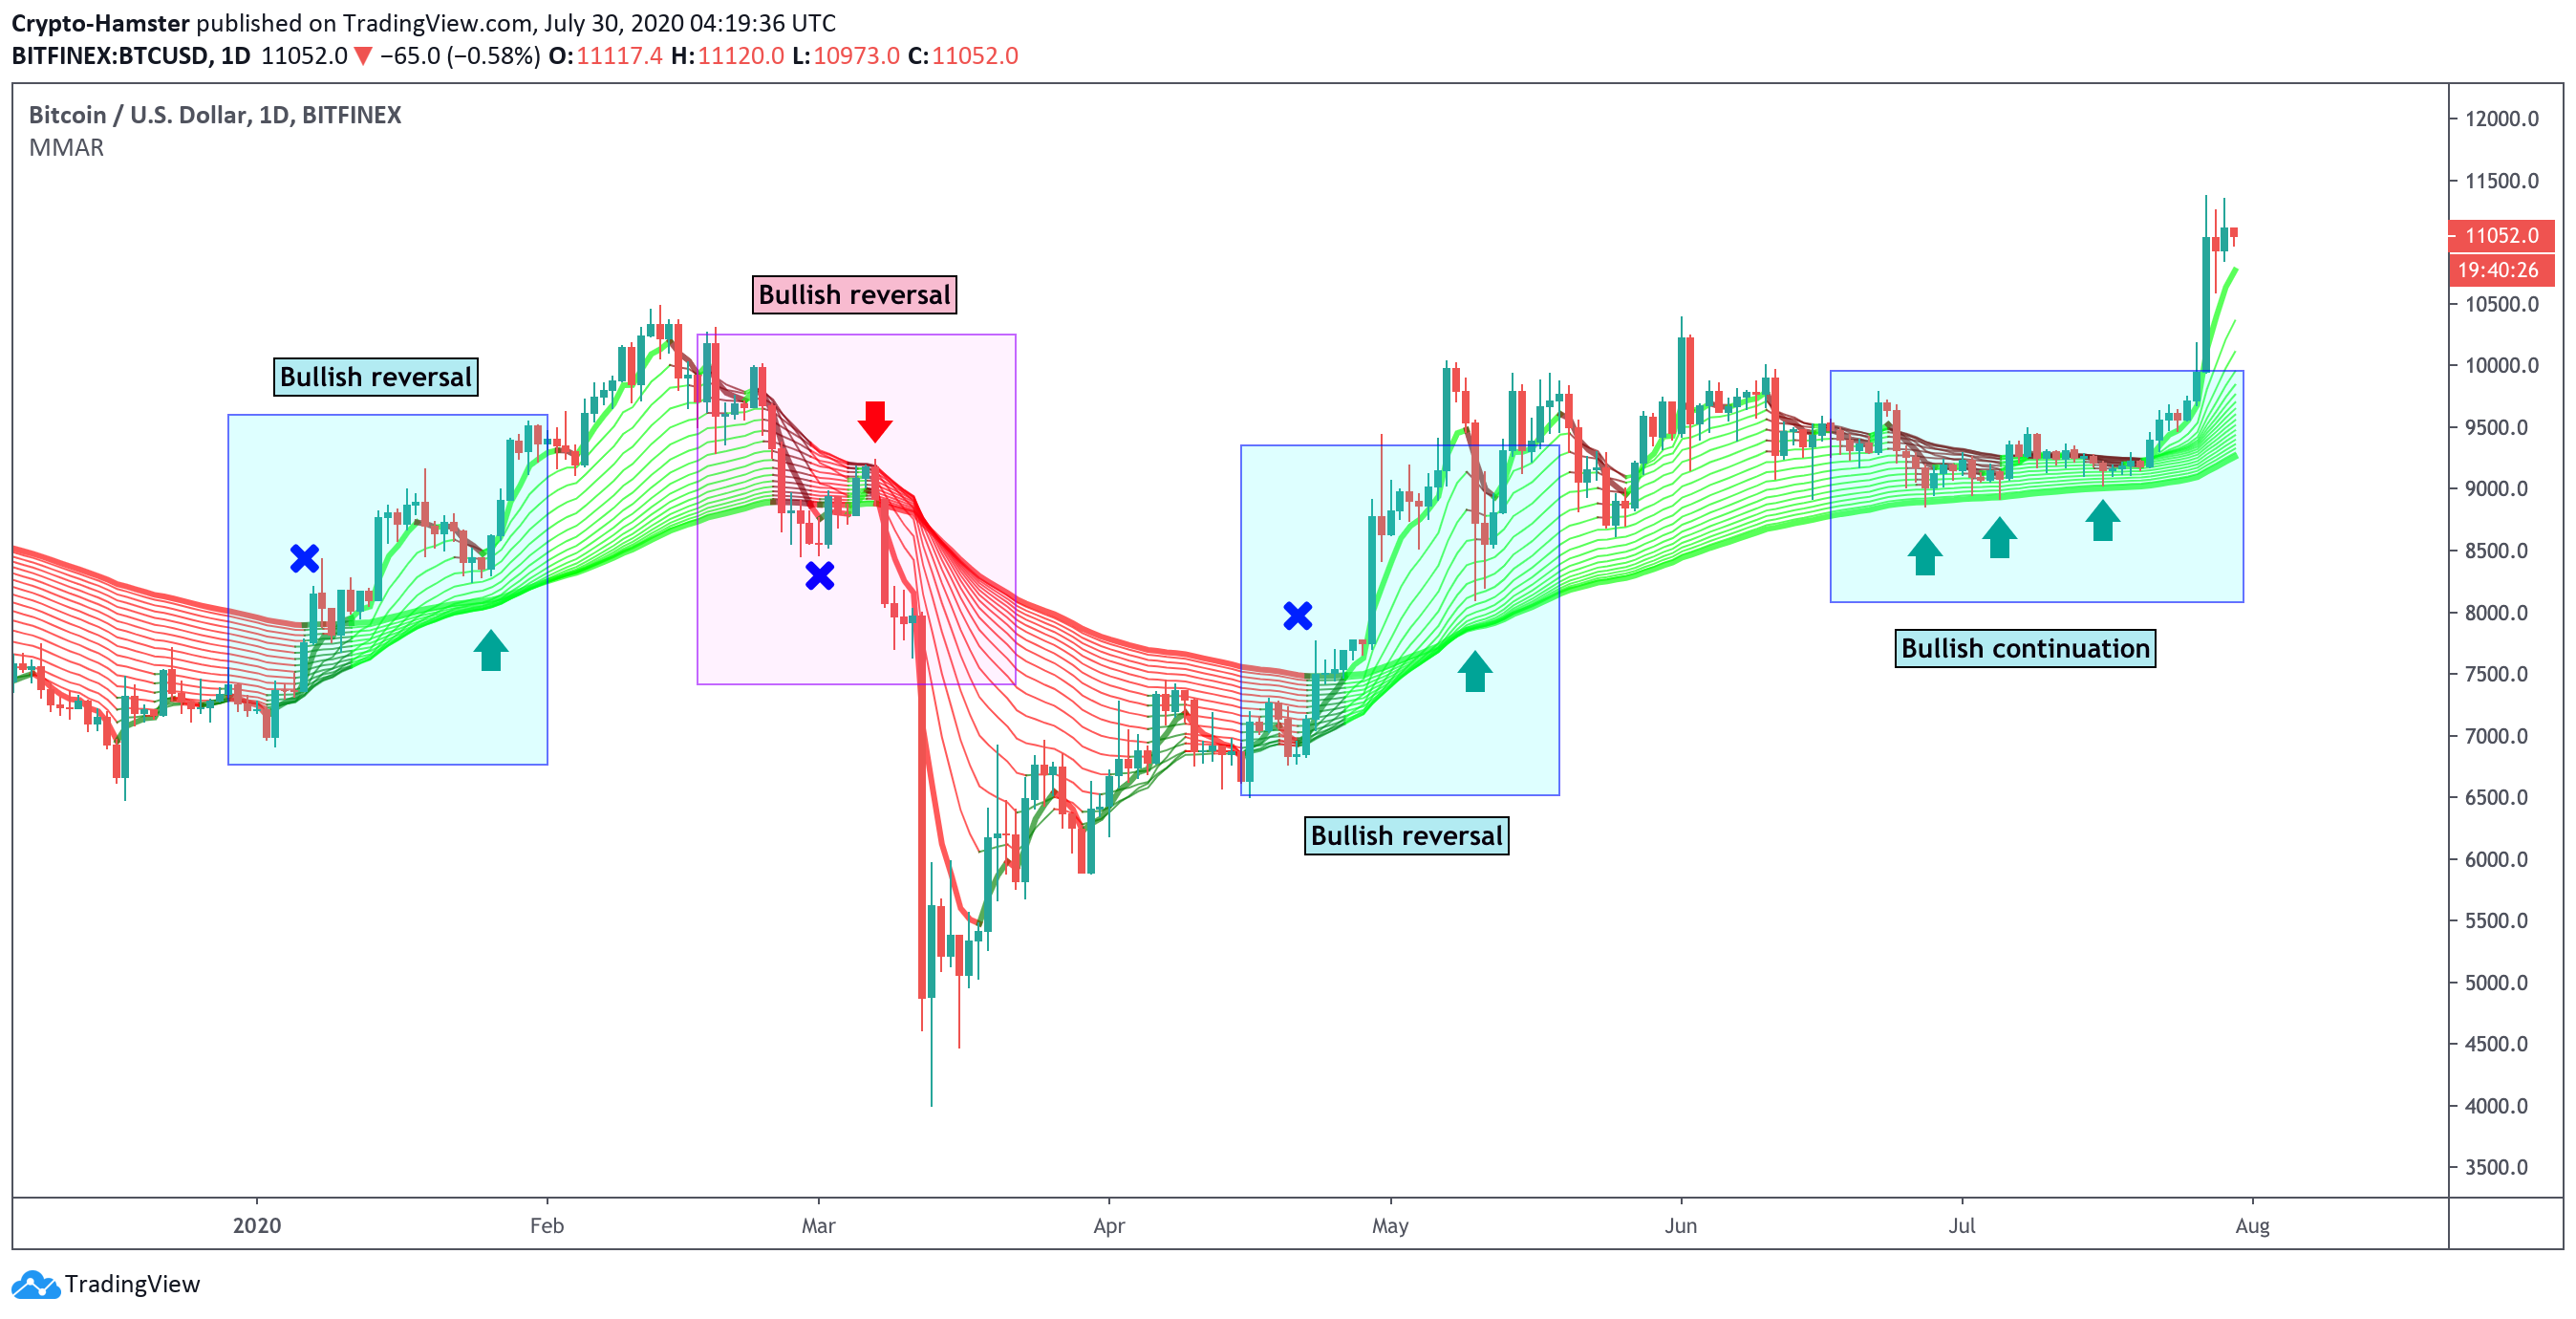
One crypto trader explains:
“If [MMR] flips color and holds upon retest, it is usually a reversal – if it gets tested and holds (no color flip), usually it is a continuation of a trend.”
With MMR still green, there is an extreme likelihood of Bitcoin to continue its upside run towards $12,000.
Macro Factors
The technical narratives are also likely to receive further support from macroeconomic narratives concerning the fears of inflation led by central banks’ relentless money printing, the US-China geopolitical dispute, as well as lower yields on the leading US Treasurys caused by near-zero interest rates.
The 2020 #Bitcoin $BTC bull run will be larger than 2017 one. 16-17 bull market was retail-driven, whereas the current bull market is driven by large US institutions who are using #Bitcoin $BTC as a hedge aginst / short on US Dollar.
— RamenPanda (@IamRamenPanda) July 30, 2020
Bitcoin was trading 1.44 percent lower at $10,949 at the time of this writing.