A new technical analysis by crypto analyst ChartNerd has predicted the long-term trajectory of the XRP price. According to the expert, the cryptocurrency could be gearing up for a new all-time high, with price targets set at an impressive $27. Already, XRP is showing signs of building momentum after its recent rebound from the $2.8 level, but ChartNerd suggests that “the ride has just begun.”
XRP Price Structure Points To $27 ATH
ChartNerd’s latest analysis on X social media outlines XRP’s long-term price structure, which has been forming since its 2018 all-time high of $3.84. After peaking and then spending nearly seven years suppressed and consolidating within a symmetrical triangle, the altcoin has finally broken free of its constraints. This breakout had triggered an explosive rally in the cryptocurrency’s price, carrying it from $0.5 to $3.6 this year in rapid succession.
Despite this impressive performance, ChartNerd explains that XRP’s price rally is far from over. The cryptocurrency’s structure suggests a much larger expansion is on the horizon, with Fibonacci Extension levels reinforcing the case for a $27 price target. Specifically, the 1.618 Fibonacci extension on the chart has been pointing to $27 ever since XRP’s 2018 high. A surge to this level would see the cryptocurrency exploding by an impressive 800% from current levels around $3.
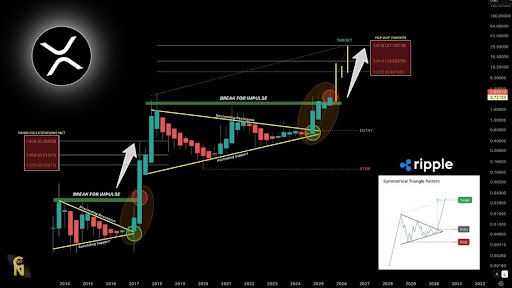
With the symmetrical triangle pattern now broken to the upside, the long-term chart suggests the token is finally ready to move toward higher levels. The analysis identifies critical points in the cryptocurrency’s bullish journey: a breakout impulse that shattered descending resistance, a new cycle of ascending support, and the confirmation of the previous Fibonacci targets. ChartNerd concludes his analysis by urging traders to prepare for a ride that has only just begun.
Analyst Says XRP To Hit $5 First
In addition to his long-term projection, ChartNerd presented a short-term analysis that predicts XRP could skyrocket from its current price of $3 to $5, representing a roughly 66% surge. He shared a price chart that shows the cryptocurrency displaying a classic Bull Flag formation—a pattern that often signals bullish continuation after an upward move.
During the time of his analysis, ChartNerd noted that XRP was bouncing off its 20-week Exponential Moving Average (EMA) around the $2.77 level, a key area of support to prevent further declines. The Bull Flag structure is clearly visible on the chart, featuring a strong flagpole that moves upward, followed by a period of consolidation within a downward-sloping flag.
The breakout target from this Bull Flag formation points directly to the 1.618 Fibonacci Extension at $5.35. ChartNerd emphasized that while the altcoin still has work to do, holding above the 20-week EMA and breaking through flag resistance are critical to fueling this projected rally. More importantly, he says that the current Bull Flag pattern lies inside a larger flag with a bullish target set at $15.