Real Vision’s chief crypto analyst Jamie Coutts believes a modest rebound in global liquidity could catapult Bitcoin well beyond six-figure territory within a year. In a note shared on X, Coutts argued that the Global Liquidity Index (GLI) has already broken to a fresh all-time high after “the longest contraction in decades,” adding that central banks “are clearly behind the curve.”
“With central banks clearly behind the curve, we could see global liquidity rise by approx. 10% or $13 trillion over the next 12 months. This would equate to $186,000 BTC using a blended regression model,” he wrote. He further encouraged long-term holders, saying, “Those who held steady and accumulated during recent market turbulence should be better for it in what comes next.”
How The Model Arrives At $186,000 Per Bitcoin
Coutts published an accompanying graphic that pairs two valuation frameworks— a log-log regression of Bitcoin versus the GLI and an elasticity-of-price model— to project 12-month prices under two scenarios.
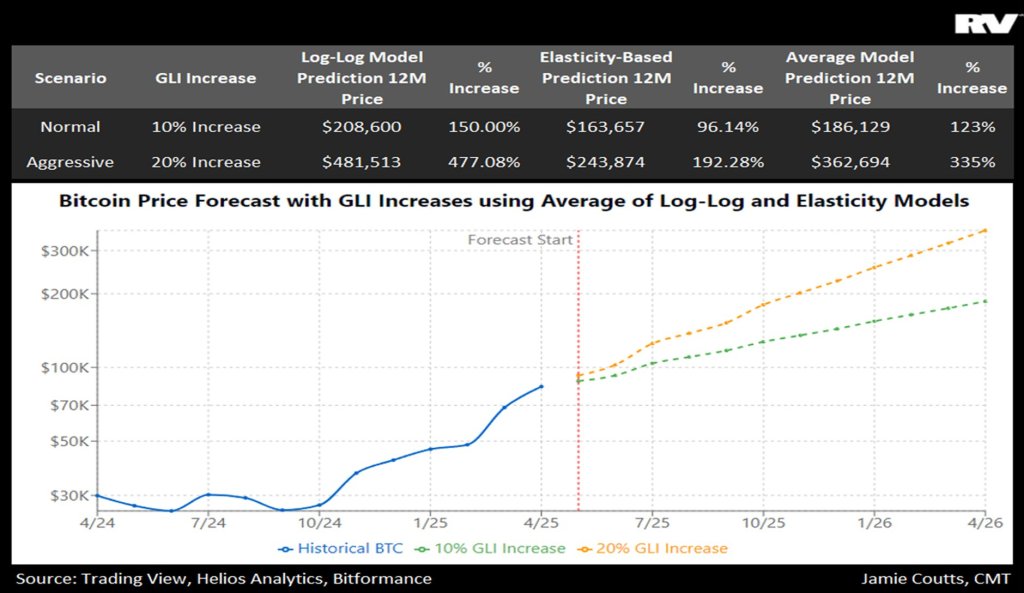
The table in the image starts from a baseline Bitcoin price of roughly $83,500 (the level at the April forecast start) and shows in a “Normal” scenario where global liquidity expands by just 10%, the log-log model points to $208,600 (a 150% gain), the elasticity approach to $163,657 (a 96% gain), and their average to $186,129, a 123% rise.
In an “Aggressive” scenario of a 20% liquidity expansion, the log-log curve vaults to $481,513 (up 477%), the elasticity curve to $243,874 (up 192%), and the blended target to $362,694, implying a 335% appreciation.
The line chart titled “Bitcoin Price Forecast with GLI Increases using Average of Log-Log and Elasticity Models” plots historical spot prices (blue) up to late April 2025 and then projects two dashed trajectories: a green path for the 10% GLI scenario that rises steadily toward the $186,000 area by April 2026, and a steeper orange path for the 20% GLI case that approaches $360,000 during the same window.
Liquidity And The Dollar
Coutts’ confidence rests on the historical relationship between a weakening US dollar and Bitcoin out-performance. In an earlier March thread he wrote: “When looking at this recent move in the DXY through a historical lens, it’s challenging to be anything but bullish…”
He back-tested every three-day decline of the Dollar Index (DXY) greater than -2% and -2.5% since 2013: For -2.5% drops (eight events), Bitcoin delivered a 100% 90-day win rate with an average return of +37% and a one-standard-deviation upside of +63% ($146,000 BTC), while the worst 90-day outcome was still a positive +14% ($102,000 BTC).
For milder -2% drops (18 events), the 90-day win rate was 94%, the average gain +31.6% ($118,000 BTC), and the +1 σ move +57.8% ($141,000 BTC), with the single losing instance printing -14.6% (“$76,500 BTC”).
Coutts conceded the statistical limitations— “the significance of medium-term signals is severely constrained by dataset history”— but maintains that both GLI trends and dollar weakness are “objective data points” that historically coincide with Bitcoin bear-market troughs or mid-cycle continuations.
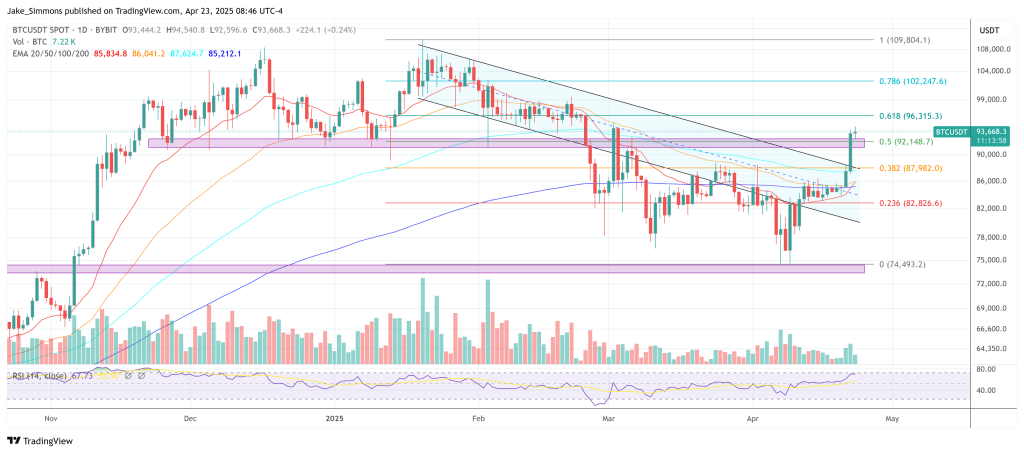
At press time BTC was trading near $93,668, keeping the analyst’s $186,000 projection roughly 100% above spot.